Observability
RBFS runs Prometheus, an open-source monitoring tool with a built-in time-series database. It gathers metrics (data) from RBFS and its microservices (brick daemons). Prometheus uses a polling model and pulls metrics data.
RBFS includes a pre-packaged Prometheus software and it does not require a separate Prometheus installation. However, to begin collecting and storing data, you must enable Prometheus observability on an RBFS device. It remains inactive until a time-series has been configured for the first time.
Prometheus observability is an optional service in RBFS.
Understanding Prometheus Observability in RBFS
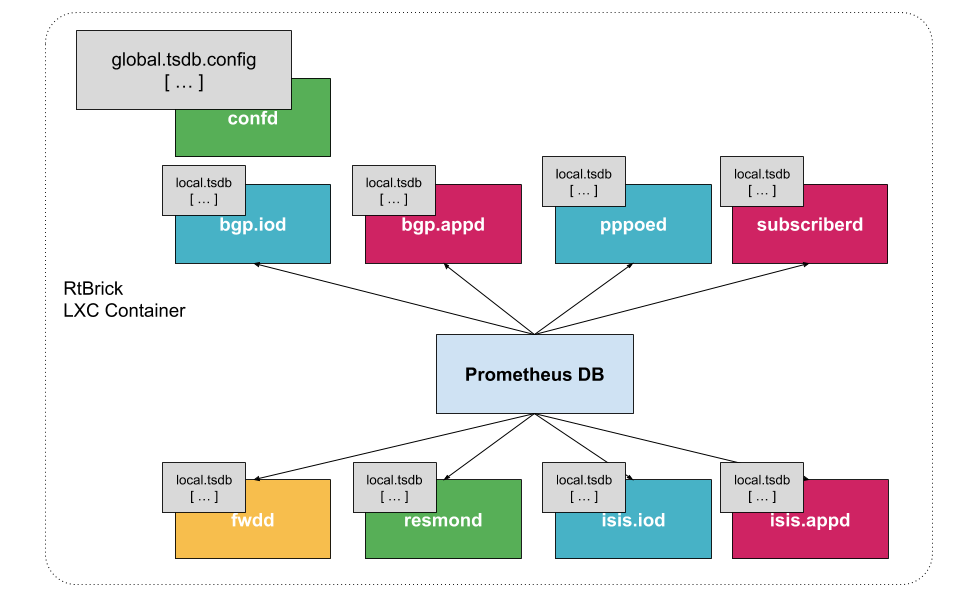
Prometheus operates as a microservice in the RBFS container and it queries at regular intervals to pull metrics data directly from various RBFS brick daemons or processes. It collects metrics and stores them with the timestamp, which shows when the data was recorded. RBFS supports direct export of metrics to Prometheus.
By monitoring and analyzing these metrics, you can assess the health of your applications, detect any anomalies, and take necessary corrective actions. You can define custom metrics.
Prometheus pulls metrics periodically from all targeted processes at a scrape interval. A scrape interval indicates how frequently these metrics are collected.
At a high level, three key operations take place:
-
Prometheus scrapes metrics from various applications and services at regular intervals.
-
The collected data is stored in a time-series database for querying and analysis.
-
Alert rules analyze the data and triggers alerts to notify about the critical events or anomalies.
Example of Scenarios When or How Time-Series Metrics Data Help
The following are a few example scenarios of how and when the observability data help network administrators:
-
Detecting Memory Leaks: A gradual increase in memory usage without a corresponding change in the PPPoE session count indicates a memory leak.
-
Predicting Hardware Failures: A persistent five-minute chassis temperature readings signals an imminent hardware fault, prompting a replacement.
-
Identifying Fabric Congestion: Consistent 80 percent utilization across all fabric interfaces suggests the need to add new fabric links.
-
Detecting Weakening Optical Links: When a network device receives a high volume of incoming traffic and simultaneously shows a drop in optical receive power, suggests that the optical signal is weakening.
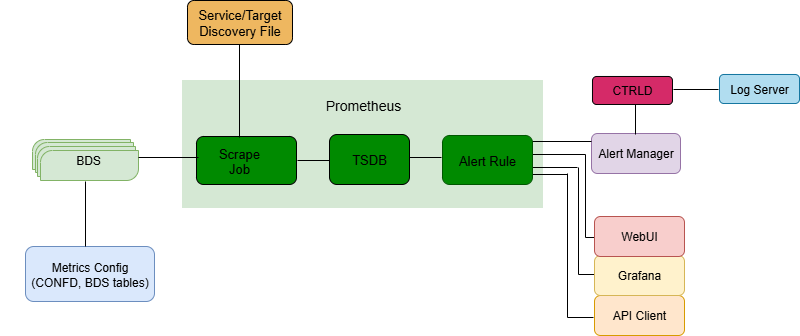
The communication uses the Prometheus exposition format, which operates through an HTTP pull from the metrics endpoint of the scrape target.
RBFS brick daemons communicate to the configuration table called global.time-series.metric.config, which lists the metrics a daemon is supposed to export. Only the BDS, which holds the data table for each daemon, responds with metrics. The data scraped by Prometheus is stored in its own local time-series database on the device.
Visualization
RBFS supports Grafana, a visualization platform, to present metrics data visually. For more information, see Grafana.
Federated Deployment of Prometheus
In a federated Prometheus deployment model, multiple Prometheus instances can be deployed hierarchically in large-scale environment. A global Prometheus instance aggregates data from other Prometheus nodes enabling hierarchical data collection. This hierarchical structure helps manage large volumes of time-series data. It is useful for environments where a single Prometheus instance is inadequate.
Prometheus Federation allows you to consolidate metrics from multiple Prometheus instances into a single, centralized instance.
The following prometheus.yml file demonstrates the global Prometheus instance configured to scrape metrics from local Prometheus instances using the '/federate' endpoint:
global:
  scrape_interval: 60s

scrape_configs:
  - job_name: "federate"
    honor_labels: true
    metrics_path: '/federate'
    params:
      'match[]':
        - '{job=~"^bds_.+"}'
    scrape_interval: 15s
    file_sd_configs:
      - files:
          - ./bds.target.yml
        refresh_interval: 5m
The 'match[]' parameter indicates the global Prometheus instance to retrieve only time-series metrics associated with the BDS job. This ensures efficient data selection and eliminates the need to modify the configuration when new aggregation rules are introduced.
The Prometheus targets, which are the local Prometheus instances from which to pull data, are defined in the 'bds.target.yml' file:
- targets: ['198.51.100.125:19091']
  labels:
    __metrics_path__: "/api/v1/rbfs/elements/rtbrick/services/prometheus/proxy/federate"
    box: 125_rtbrick
This configuration specifies the endpoint to scrape and assigns custom labels to the data, such as identifying the RBFS device.
For more information about Prometheus Federation, see Prometheus Federation.
Control Daemon
Control Daemon (CtrlD) is a key component that facilitates service discovery, state monitoring, and proxying for other services within a monitoring architecture. It interacts with Prometheus for metrics collection and Alertmanager for alert management.
CtrlD operates as a proxy and acts as a middle layer to handle requests without querying Prometheus directly. Both Prometheus and Alertmanager are registered with CtrlD, allowing it to be aware of their existence and track their operational state (whether they are up or down). Alertmanager manages alerts triggered by Prometheus based on predefined conditions. When an alert is triggered in Alertmanager, CtrlD forwards these alerts to external destinations, such as Grafana.
CtrlD can also be used to make Prometheus queries via HTTP. For example:
curl 'http://198.51.100.125:19091/api/v1/rbfs/elements/rtbrick/services/prometheus/proxy/api/v1/query?query=up' | jq .
This command queries Prometheus to check the status of the services to see if they are up.
For federation, the following URL allows for sharing data between multiple Prometheus instances:
http://198.51.100.125:19091/api/v1/rbfs/elements/rtbrick/services/prometheus/proxy/federate
Down-sampling:
RBFS supports down-sampling for Prometheus federated deployment. It helps to reduce the amount of stored data by averaging, aggregating, or sampling over a specified period of time. The mechanism involves grouping the data over time periods and calculating things based on averages, sums, or maximums.
Metrics and Metric Profiles
Metrics
Metrics are data points that are recorded with a timestamp to create a metric time-series. The metric as such is the current value. Storing the metric values with a timestamp forms a metric time-series which can then be scanned for anomalies or used for trend analysis. Metrics are often accompanied by labels, which provide additional context about the data. For example, a CPU usage metric can include labels that indicate the instance or application that it belongs to.
Index Metrics and Object Metrics:
Index Metric and Object Metrics are two different ways of storing and querying time-series data. They differ in how they are used to store and retrieve time-series data. Index-metrics refer to metrics stored within the index of Prometheus.
Object-metrics are the actual data points, stored within the Prometheus. They represent the measured values over time.
Metric Filters
Filters allow you to include or exclude specific BDS objects based on the objects attributes. The filtering is only applicable on 'bds-type object-metric', it is not supported on 'index-metric'.
For more information, see Metrics.
Attributes
Attributes represent the numeric fields (columns) in BDS tables that are monitored and exported as time-series metrics. These are the actual data points such as packet counters, byte counters and so on. Attributes are key elements because they determine the specific information to be collected. The attributes specify which state will be exported.
| This attribute must be either a numeric type or a type that can be converted to numeric. |
Labels
Labels (Attribute Labels) provide additional context and metadata about metrics. They are key-value pairs attached to metrics. Labels help differentiate between different instances of the same attribute. For example, when Prometheus monitors multiple applications simultaneously, each application may have a system_memory_used_bytes metric. Labels enable Prometheus to store multiple metrics from various sources under a single metric name.
Moreover, attribute labels are useful for filtering, grouping, and analyzing metrics across different entities. They are necessary for uniquely identifying metric streams, especially when the same attribute appears in multiple rows of a table.
For more information, see Metrics Labels.
Filters
Filters (Attribute Filters) are used to narrow down the objects of a table should be considered for metric generation. In some tables, there may be hundreds of entries, but you may only track metrics for a few specific rows. Filters let you define conditions (match rules) that rows must meet to be included in metric generation.
Metric Profiles
In RBFS, you can create metric profiles that allow you to group multiple metrics which share the same characteristics, such as metrics from the same application or instances. Instead of configuring each metric individually, you can define the scrape interval and the append-timestamp flag commonly for all associated metrics in a metric profile.
If you do not explicitly assign a metric to a specific metric profile, it will be by default assigned to the default metric profile. This default profile is set to scrape metrics every 5 seconds. If you do not create or use any custom metric profile, all metrics will automatically fall under this default profile. Also, if you do not define any custom metric profile, Prometheus scrapes all daemons that expose metrics in every 5 seconds.
Alert and Alert Profiles
Alert
You can configure Prometheus to generate alerts based on defined rules, which are then managed by the Alert Manager.
Alerts are triggered based on rules that evaluate time-series data stored in the Prometheus. When the specified conditions are met, the alert manager notifies CtrlD which forwards the notification to the configured GELF or syslog servers.
For more information, see Alerting and Alertmanager.
Alert Profile
An alert profile allows you to group multiple alerts into a single profile by applying the same characteristics to them. The alert profile also controls the repeat interval, which specifies how often a notification will be repeated if the underlying alert condition remains unresolved.
Tracking Invalid Time-series Configurations
RBFS provides the ability to track invalid time-series configurations applied to RBFS. This functionality helps to debug Prometheus time-series that are not in the expected state (for example, missing labels) due to configuration settings that cause runtime issues. This functionality is enabled by default. You can view the list of misconfigurations using the show command: show time-series metric <metric-name> rtbrick_invalid_metric_config.
Monitoring Daemon Status
The built-in Prometheus 'up' metrics must not be used to monitor the brick daemons. Prometheus scrapes only metrics from daemons that actually expose metric data. RBFS allows you to monitor the state of the daemons whether they are operational or not. You can enable the functionality. For configuration information, see section Monitoring Daemon Status.
Prometheus Self-Monitoring
With the self-monitoring functionality, Prometheus can monitor its own performance and health. This functionality gathers metrics related to Prometheus' own operations that include query performance and resource usage.
Append Timestamp
RBFS allows you to enable Append Timestamp on both metric or metric profile level. When the append timestamp flag is set, the first metric generated after an object is updated will include the actual timestamp of the update. This accurately reflects when the change took place. For all subsequent metrics for the same object (since it has not been updated again) the current scrape time will be used.
Storage
On average, Prometheus uses only about 1 to 2 bytes per sample. Therefore, to plan the capacity of a Prometheus server, you can use the following rough formula:
needed_disk_space = retention_time_seconds * ingested_samples_per_second * bytes_per_sample
The disk space for the single binaries:
-rwxr-xr-x 1 root root 27M Sep 2 22:51 alertmanager +
-rwxr-xr-x 1 root root 81M Sep 2 22:51 prometheus +
-rwxr-xr-x 1 root root 49M Sep 3 19:55 promtool
Use the 'promtool' for testing configurations before setting them in Prometheus. For information, see promtool.
For more information about storage, see Storage.