Time-series Configurations in RBFS
Configuration Overview
RBFS does not require a separate Prometheus software installation as it includes a pre-packaged Prometheus software. The time-series configuration defines how time-series data is collected, stored, and transported to external systems. The configuration allows RBFS to stream time-series data from its microservices and processes to the integrated Prometheus collector.
It allows you to define metric profiles, create individual metrics, and associate those metrics with specific metric profile.
RBFS time-series metric configurations at a high level:
-
Metric Profile Configuration: Define common settings that include scrape interval and append timestamp for a group of metrics.
-
Metric Configuration: Configure the parameters of the metrics which are to be collected and exported. It includes the BDS table that contains the operational state to be converted into a time-series. You can define attributes, filters, and labels. They help in tagging, querying, filtering, and grouping the data in the time-series database.
-
Attribute Configuration (Mandatory): Define the BDS attributes that will be exported.
-
Define Filters (Optional): Filters the BDS objects which are going to be exported based on defined criteria. This is required when the BDS table contains more than one object.
-
Define Labels (Optional): It identifies and clarifies time services coming from different BDS objects by labeling them with metadata. Allows for querying, grouping, and filtering in time-series data.
-
-
Alert Configuration: Inform about specific conditions in the system based on the captured metrics.
-
Alert Profile Configuration: Group multiple alerts into a single profile by applying notification rules to alerts with similar characteristic.
-
Enabling Data History Retention: Option for debugging. If enabled, BDS logs the BDS queries that were executed to retrieve the telemetry data from BDS.
-
Enabling Prometheus Self Monitoring: Prometheus can monitor its own health state.
-
Monitoring Daemon Status: Monitor the status of system daemons (processes), specifically to track whether they are operational or not.
| In previous releases, there was a built-in Prometheus 'UP' metric to monitor the status of the daemon and determine whether it was up or down. However, this built-in functionality is no longer available. You can now define your own custom metric to achieve the same monitoring capabilities. |
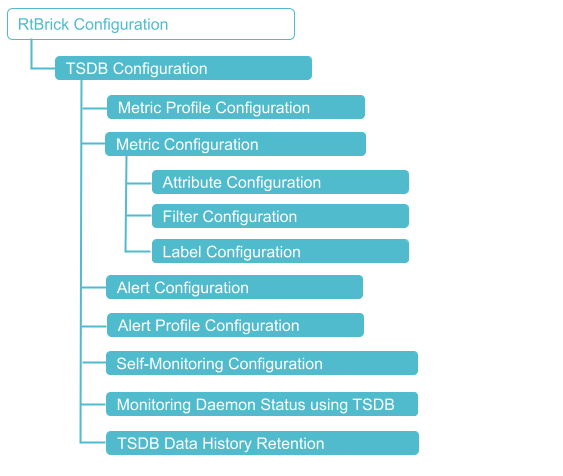
Configuration Hierarchy
The diagram illustrates the Prometheus configuration hierarchy.
Configuration Syntax and Commands
The following sections describe the time-series configuration syntax and commands.
Guidelines for Naming
Metric and Metric Profile names must not start with "rtbrick," as this name is reserved for internal use. Also, RBFS has built-in default metric profile; therefore, the custom metric profile names must not be "default".
Metric Configuration
Metric configuration is used to configure the operational state which is to be exported.
|
Syntax:
| Attribute | Description | ||
|---|---|---|---|
|
Name of the metric. See Naming Conventions. |
||
|
Set the append-timestamp to true for exporting the metric values with timestamp. By default, the value is 'false'. The timestamp is the epoch represented in milliseconds, and its value corresponds to the creation time of the current metrics in RBFS. |
||
|
Specifies the name of the attribute in the target table which is to be scraped and exported. |
||
|
Specifies the type of metric, that is scraped and exported. There are two types, object-metric and index-metric.
|
||
|
|
||
|
Description for the metric. Allowed range of 128 characters. |
||
|
Specifies the matching attribute name for the filter. |
||
|
Specifies whether the configuration needs to be applied on a subscribed tables as well. Default: false. |
||
|
Specifies the index-name if the 'bds_metric_type' is index-metric. This is applicable for index-metric only. |
||
|
Configures the Prometheus metric type. Currently, the supported Prometheus metric types are 'counter' and 'gauge'. |
||
|
Specifies the target table from which the data is scraped and exported (can be a regular expression). |
 To access the RESTCONF API that corresponds to this CLI, click
here.
To access the RESTCONF API that corresponds to this CLI, click
here.
Example:
This configuration is used to export fan speed telemetry data from the sensor table for only chassis fans. It defines a time-series metric named 'chassis_fan_speed_rpm' for telemetry that captures chassis fan speed (in RPM) from a sensor table called global.chassis_0.resource.sensor.fan (which contains sensor data, including fans).
The 'bds-type' is defined as 'object-metric', which means the metric is based on object-like data entries in the table. The 'prometheus-type' is specified as 'gauge', that is for numeric values that can go up or down. The description for the metric is added as 'Chassis fan speed in rpm'.
A filter is applied to the 'resource_name' column, with the 'match-attribute-value' set to 'Chassis'. The match-type is defined as 'regular-expression'. This filter determines which rows in the source table (global.chassis_0.resource.sensor.fan) will be included when generating this metric. It specifically matches rows where the value of 'resource_name' satisfies the regular expression for 'Chassis'.
Also, a second filter is applied to the 'resource_type', which only includes rows where the value is exactly 'fan'. It ensures an exact string match. This makes sure that only fan-related resource entries are considered and filtered out irrelevant sensors.
set time-series metric chassis_fan_speed_rpm
set time-series metric chassis_fan_speed_rpm table-name global.chassis_0.resource.sensor.fan
set time-series metric chassis_fan_speed_rpm include-subscribed-tables false
set time-series metric chassis_fan_speed_rpm bds-type object-metric
set time-series metric chassis_fan_speed_rpm prometheus-type gauge
set time-series metric chassis_fan_speed_rpm description "Chassis fan speed in rpm"
set time-series metric chassis_fan_speed_rpm filter resource_name
set time-series metric chassis_fan_speed_rpm filter resource_name match-attribute-value Chassis
set time-series metric chassis_fan_speed_rpm filter resource_name match-type regular-expression
set time-series metric chassis_fan_speed_rpm filter resource_type
set time-series metric chassis_fan_speed_rpm filter resource_type match-attribute-value fan
set time-series metric chassis_fan_speed_rpm filter resource_type match-type exact
set time-series metric chassis_fan_speed_rpm attribute rpm
set time-series metric chassis_fan_speed_rpm attribute rpm label fan
set time-series metric chassis_fan_speed_rpm attribute rpm label fan label-value resource_name
set time-series metric chassis_fan_speed_rpm attribute rpm label fan label-type dynamic
Example:
supervisor@rtbrick.net: cfg> show config time-series metric chassis_fan_speed_rpm
{
  "rtbrick-config:metric": [
    {
      "name": "chassis_fan_speed_rpm",
      "table-name": "global.chassis_0.resource.sensor",
      "bds-type": "object-metric",
      "prometheus-type": "gauge",
      "description": "Chassis fan speed in rpm",
      "filter": [
        {
          "match-attribute-name": "resource_name",
          "match-attribute-value": "CHASSIS.*",
          "match-type": "regular-expression",
          "match-negate": "false"
        },
        {
          "match-attribute-name": "resource_type",
          "match-attribute-value": "fan",
          "match-type": "exact",
          "match-negate": "false"
        }
      ],
      "attribute": [
        {
          "attribute-name": "rpm",
          "label": [
            {
              "label-key": "fan",
              "label-value": "resource_name",
              "label-type": "dynamic"
            },
            {
              "label-key": "status",
              "label-value": "status_code",
              "label-type": "dynamic"
            }
          ]
        }
      ]
    }
  ]
}
Example for Index Metric Configuration
The following is an example for index metric configuration.
This configuration defines a time-series metric called 'local_bds_statistics.' It retrieves data from the source table named 'local.bds.statistics.' The 'bds-type' is classified as an index-metric, indicating that this metric is based on an index. The Prometheus type is specified as 'counter,' which means this is a counter metric. The 'index-name' is set to 'immutable-index.'
The attribute 'active-entry-count' is defined to specify a particular attribute from the source table that will be included in the metric. Labels are assigned to indicate the attributes. This configuration enables the export of the 'active-entry-count' from the 'local.bds.statistics' table into Prometheus as a counter-type metric, tagged with a static label and indexed using the immutable index.
set time-series metric local_bds_statistics
set time-series metric local_bds_statistics table-name local.bds.statistics
set time-series metric local_bds_statistics bds-type index-metric
set time-series metric local_bds_statistics prometheus-type counter
set time-series metric local_bds_statistics index-name immutable-index
set time-series metric local_bds_statistics description "This metric is exported from local.bds.statistics by all BDs"
set time-series metric local_bds_statistics attribute active-entry-count
set time-series metric local_bds_statistics attribute active-entry-count label active_entry_count
set time-series metric local_bds_statistics attribute active-entry-count label active_entry_count label-value active_entry_count
set time-series metric local_bds_statistics attribute active-entry-count label active_entry_count label-type static
supervisor@rtbrick.net: cfg> show config time-series metric local_bds_statistics
{
  "rtbrick-config:metric": [
    {
      "name": "local_bds_statistics",
      "table-name": "local.bds.statistics",
      "bds-type": "index-metric",
      "prometheus-type": "counter",
      "index-name": "immutable-index",
      "description": "This metric is exported from local.bds.statistics by all BDs",
      "attribute": [
        {
          "attribute-name": "active-entry-count",
          "label": [
            {
              "label-key": "active_entry_count",
              "label-value": "active_entry_count",
              "label-type": "static"
            }
          ]
        }
      ]
    }
  ]
}
Example Metric Configuration for Monitoring Daemon Status
This configuration defines a metric named process_status, which extracts data from a specific internal system table called global.process.status. The BDS type is defined as object-metric, indicating that the metric is derived from an object table. In the configuration, the metric type is specified as a gauge. It indicates increase or decrease, for example 1 for UP and 0 for DOWN.
The description provided is "testing UP metrics." The main attribute is defined as operational_status, and its values will be exported as part of the metric from the table.
Additionally, the configuration introduces a label called administrative_state for the metric. The value for this label will be sourced from the admin_status column in the same row of the table. It is marked as dynamic, meaning the label value can vary at runtime for each row of data.
set time-series metric process_status
set time-series metric process_status table-name global.process.status
set time-series metric process_status bds-type object-metric
set time-series metric process_status prometheus-type gauge
set time-series metric process_status description "monitor daemon status metrics"
set time-series metric process_status attribute operational_status
set time-series metric process_status attribute operational_status label administrative_state
set time-series metric process_status attribute operational_status label administrative_state label-value admin_status
set time-series metric process_status attribute operational_status label administrative_state label-type dynamic
set time-series metric process_status attribute operational_status label bd
set time-series metric process_status attribute operational_status label bd label-value process
set time-series metric process_status attribute operational_status label bd label-type dynamic
Example:
{
  "rtbrick-config:metric": [
    {
      "name": "process_status",
      "table-name": "global.process.status",
      "bds-type": "object-metric",
      "prometheus-type": "gauge",
      "description": "monitor daemon status metrics",
      "attribute": [
        {
          "attribute-name": "operational_status",
          "label": [
            {
              "label-key": "administrative_state",
              "label-value": "admin_status",
              "label-type": "dynamic"
            },
            {
              "label-key": "bd",
              "label-value": "process",
              "label-type": "dynamic"
            }
          ]
        }
      ]
    }
  ]
}
To access the RESTCONF API that corresponds to this CLI, click
here.
Metric Attributes
Attributes are used for extracting specific values from the table data.
| The number of labels is limited to 50 labels per metric. |
Metric Filters
Filters allow you to include or exclude specific BDS objects based on the objects attributes.
| The list of attribute filters determines which table rows are included in metric generation. All filters in this list must match to generate the metric, so the list functions as an implicit AND. |
Metric Labels
Labels are key-value metadata on metrics. For example, it adds related labels such as CPU ID, interface name, and so on.
| Each unique combination of key-value label pairs creates a new time series, which can significantly increase the amount of data stored. Avoid using labels to represent dimensions with high cardinality, such as user IDs, email addresses, or other sets of values that can vary widely. |
To access the RESTCONF API that corresponds to this CLI, click
here.
Tracking Invalid Time-series Configurations
RBFS offers functionality to track invalid time-series configurations that cause runtime issues. For example, when Prometheus reports duplicate time-series data due to wrong labels.
You can view the list of misconfiguration using the show command:
show time-series metric rtbrick_invalid_metric_config
There are six error types for invalid configurations in RBFS:
| Error Type | Description |
|---|---|
|
This error occurs due to a invalid filter name. If the configured filter attribute is not present in the table, this error is shown. If this error occurs, the filter does not have any effect, and there may be many objects get exported. |
|
This error occurs due to a invalid attribute name. If the configured attribute is not present in the table, then this error is shown. If this error occurs, the expected metric does not appear as the configured attribute does not exist. |
|
This error occurs due to a invalid type of attribute. If the configured attribute is present in the table and if the datatype is wrong, then this error is shown. if this error occurs, the expected metric does not show up, because the attribute does not contain a numeric value or its value cannot be converted into a numeric value. |
|
This error occurs due to a invalid key name. If the configured label attribute is not present in the table, then this error is shown. If this error occurs, Prometheus may process duplicate time-series entries due to missing labels. Filtering time-series does not work. |
|
This error occurs due to a invalid label attribute type. If the configured label attribute is present in the table and if the datatype is wrong, this error is shown. the configured label attribute is not present in the table, then this error is shown. If this error occurs, Prometheus may process duplicate time-series entries due to missing labels. Filtering time-series does not work. |
|
This error occurs due to a invalid filter attribute type. If the configured filer attribute is present in the table and if the datatype is wrong, this error is shown. |
The following sections provide examples for various error types with invalid configurations:
Error Type 1: Invalid Filter
In this configuration, the filter name 'invalid_filter' is used as a key instead of specifying a valid attribute. So, this is not a valid configuration.
set time-series metric bgp_default_peer_state filter invalid_filter
set time-series metric bgp_default_peer_state filter invalid_filter match-attribute-value Active
set time-series metric bgp_default_peer_state filter invalid_filter match-type exact
supervisor@rtbrick.net: cfg> show config time-series metric bgp_default_peer_state filter invalid_filter
{
  "rtbrick-config:filter": [
    {
      "match-attribute-name": "invalid_filter",
      "match-attribute-value": "Active",
      "match-type": "exact"
    }
  ]
}
Error Type 2: Invalid Attribute
In this configuration 'invalid_attribute' is not a valid attribute for the metric 'bgp_default_peer_state'. So, this is not a valid configuration.
set time-series metric bgp_default_peer_state attribute invalid_attribute
supervisor@rtbrick.net: cfg> show config time-series metric bgp_default_peer_state attribute invalid_attribute
{
  "rtbrick-config:attribute": [
    {
      "attribute-name": "invalid_attribute"
    }
  ]
}
Error Type 3: Invalid Attribute Type
In this configuration, though 'af_configured' exists, it is not of a supported data type for metrics. So, this is not a valid configuration.
set time-series metric bgp_default_peer_state attribute af_configured
supervisor@rtbrick.net: cfg> show config time-series metric bgp_default_peer_state attribute af_configured
{
  "rtbrick-config:attribute": [
    {
      "attribute-name": "af_configured"
    }
  ]
}
Error Type 4: Invalid Label
In this configuration the 'invalid_label' is not a valid label key. So this is not a valid configuration.
set time-series metric bgp_default_peer_state attribute state label invalid_label
{
  "rtbrick-config:label": [
    {
      "label-key": "invalid_label",
      "label-value": "invalid_label",
      "label-type": "dynamic"
    }
  ]
}
Error Type 5: Invalid Label Type
error type5: invalid_label_attribute_type
In this configuration, the label value ('af_configured') has a data type that is not allowed for label values. So this is not a valid configuration.
set time-series metric bgp_default_peer_state attribute state label invalid_label_type
set time-series metric bgp_default_peer_state attribute state label invalid_label_type label-value af_configured
set time-series metric bgp_default_peer_state attribute state label invalid_label_type label-type dynamic
supervisor@rtbrick.net: cfg> show config time-series metric bgp_default_peer_state attribute state label invalid_label
_type
{
  "rtbrick-config:label": [
    {
      "label-key": "invalid_label_type",
      "label-value": "af_configured",
      "label-type": "dynamic"
    }
  ]
}
Error Type 6: Invalid Filter Attribute Type
error type5: invalid_filter_attribute_type
In this configuration, the filter value ('af_configured') has a data type that is not allowed for filter values. So this is not a valid configuration.
set time-series metric bgp_default_peer_state filter af_configured
set time-series metric bgp_default_peer_state filter af_configured match-attribute-value ipv4-unicast
set time-series metric bgp_default_peer_state filter af_configured match-type exact
supervisor@rtbrick.net: cfg> show config time-series metric bgp_default_peer_state filter af_configured
{
  "rtbrick-config:filter": [
    {
      "match-attribute-name": "af_configured",
      "match-attribute-value": "ipv4-unicast",
      "match-type": "exact"
    }
  ]
}
To see show command output for the error types for invalid configurations, see the section Show Command Output for Invalid Metric Configuration
Metric Profile Configuration
In a metric profile, you can club a collection of related metrics, which can be managed and exported together.
You can create a metric profile and associate a individual metric with the profile. It allows you to define a common setting such as scrape interval and append-timestamp for a group of metrics. This common settings will be applied automatically to all associated metrics. You can configure a maximum of 100 metric profiles.
| If you do not configure a Metric Profile, the system will use a default metric profile with a predefined scrape interval. |
Syntax:
| Attribute | Description |
|---|---|
|
Specify the name of the profile. Note: Metric Profile names must not begin with the name 'rtbrick' as it is reserved for internal use. Similarly, RBFS has built-in default metric profiles, therefore, do not use the name 'default' as metric profile name. |
|
The frequency (period of time) at which the system fetches (scrapes) data from a target source. |
|
Add a time-stamp on every metric pulled. |
Example:
This configuration defines a metric profile called "up_metrics." The configuration sets the scrape interval to 10 seconds, meaning that metrics linked to this metric profile will be collected every 10 seconds.
set time-series metric-profile up_metrics
set time-series metric-profile up_metrics scrape-interval 10s
Example:
{
  "rtbrick-config:metric-profile": [
    {
      "profile-name": "up_metrics",
      "scrape-interval": "10s"
    }
  ]
}
Attaching a Metric with a Metric Profile
You can associate an existing metric with an existing metric profile.
Syntax:
| Attribute | Description |
|---|---|
|
Specify the metric name. |
|
Specify the metric profile name. |
To access the RESTCONF API that corresponds to this CLI, click
here.
The following command is used to associate a metric named 'process_status' with the metric profile named 'up_metrics'.
set time-series metric process_status profile-name up_metrics
Example:
supervisor@rtbrick.net: cfg> show config time-series metric process_status profile-name
{
  "rtbrick-config:profile-name": "up_metrics"
}
Alert Configuration
You can configure alerts which are notifications about the events based on the captured metrics.
| Alerts cannot be assigned to an alert profile. It is the alert profiles that are used to forward alerts. For each alert, the system will utilize the first matching profile from the list of available alert profiles. The priority attribute of each profile determines the order in which alerts are processed. |
Syntax
| Attribute | Description |
|---|---|
|
Key-value pairs that add metadata to the alert. |
|
Alert description. |
|
PromQL Alert evaluation. It defines condition for triggering this alert. |
|
Specifies the duration the condition must be true before triggering the alert. |
|
Logical grouping of alerts. |
|
Defines how often this alert expression (expr) is evaluated (for example, every 30s, 1m, and so on). |
|
Key-value pairs used to categorize alerts, mainly for routing in Alertmanager. |
|
Alert’s severity level. |
|
Explicit annotation label summary. |
To access the RESTCONF API that corresponds to this CLI, click
here.
Example:
This configuration defines a time-series alert named 'chassis_fan_failure', which monitors the speed of chassis fans using time-series metrics. The alert continuously checks fan speeds and triggers if the fan speed remains below 1500 RPM for 5 consecutive minutes, with checks occurring every minute. It is organized under the group labeled "fans," which categorizes similar alerts.
The alert is assigned a severity level of 2 and the label "repeat_interval" is set to 24 hours, meaning the alert will not be resent more than once within that timeframe. Additional annotations include metadata such as the threshold (1500 RPM), the unit, the actual fan speed at the time of the alert, and the direction (below).
The alert only triggers if the condition holds true for a continuous 5-minute period. Specifically, it checks whether the maximum fan speed (in RPM) over the last 60 seconds is less than 1500. This alert serves to monitor for any fan failures, and if the speed is below the threshold for 5 minutes, it will trigger an alert.
set time-series alert chassis_fan_failure
set time-series alert chassis_fan_failure group fans
set time-series alert chassis_fan_failure for 5m
set time-series alert chassis_fan_failure interval 1m
set time-series alert chassis_fan_failure expr "max_over_time(chassis_fan_speed_rpm[60s]) < 1500"
set time-series alert chassis_fan_failure level 2
set time-series alert chassis_fan_failure summary "Fan speed {{$value}}rpm of fan {{$labels.fan}} is below 1500rpm."
set time-series alert chassis_fan_failure description "Fan speed is below 1500rpm"
set time-series alert chassis_fan_failure labels repeat_interval:24h
set time-series alert chassis_fan_failure annotations threshold:1500
set time-series alert chassis_fan_failure annotations unit:RPM
set time-series alert chassis_fan_failure annotations value:{{$value}}
set time-series alert chassis_fan_failure annotations "direction: below"
Example:
supervisor@rtbrick.net: cfg> show config time-series alert chassis_fan_failure
{
  "rtbrick-config:alert": [
    {
      "name": "chassis_fan_failure",
      "group": "fans",
      "for": "5m",
      "interval": "1m",
      "expr": "max_over_time(chassis_fan_speed_rpm[60s]) < 1500",
      "level": "2",
      "summary": "Fan speed {{$value}}rpm of fan {{$labels.fan}} is below 1500rpm.",
      "description": "Fan speed is below 1500rpm",
      "labels": [
        "repeat_interval:24h"
        ],
      "annotations": [
        "threshold:1500",
        "unit:RPM",
        "value:{{$value}}",
        "direction: below"
        ]
    }
  ]
}
Alert Profile Configuration
You can set up alert profiles for Prometheus time-series data. This configuration defines alerts, how alerts should be grouped, filtered, and repeated.
Syntax
| Attribute | Description |
|---|---|
|
Specify the name of the alert profile. |
|
Specify the priority number. |
|
Groups alerts by one or more labels. |
|
Filters which alerts are processed by this profile. |
|
Defines how frequently notifications for unresolved alerts will be resent. |
To access the RESTCONF API that corresponds to this CLI, click
here.
The following configuration defines a time-series alert profile named '4h_receiver'. This profile specifies how alerts that meet certain criteria should be managed.
The priority level is set to '1', indicating that this alert profile has high priority, as lower numbers indicate higher preference. The 'repeat-interval' is configured for '4h', meaning that alerts associated with this profile will be resent every 4 hours if they remain active. In essence, alerts under this profile are sent once every 4 hours.
The 'matchers' parameter is defined as 'repeat_interval=4h', which filters the alerts to which this profile applies. Only alerts with the label 'repeat_interval=4h' will be managed by this profile.
set time-series alert-profile 4h_receiver
set time-series alert-profile 4h_receiver priority 1
set time-series alert-profile 4h_receiver repeat-interval 4h
set time-series alert-profile 4h_receiver matchers repeat_interval=4h
{
  "rtbrick-config:alert-profile": [
    {
      "profile-name": "4h_receiver",
      "priority": 1,
      "repeat-interval": "4h",
      "matchers": [
        "repeat_interval=4h"
        ]
    }
  ]
}
Enabling Time-series Query History
All BDS queries related to time-series exposure will be logged in a BDS table for review during issue debugging. By default, time series database history is disabled.
Syntax
| Attribute | Description |
|---|---|
|
Enable time series database history by specifying 'enable'. Time-series database history is disabled, by default. |
Example:
The following configuration enables timeseries history status by specifying 'enable'.
set time-series history-status enable
supervisor@rtbrick.net: cfg> show config time-series history-status
{
  "rtbrick-config:history-status": "enable"
}
Prometheus Self-Monitoring Configuration
You can enable a self-monitoring feature that allows Prometheus to monitor its own performance and health. This self-monitoring functionality collects metrics regarding the system’s operation, such as query performance and resource usage. The scrape interval determines how often these metrics are collected.
Syntax:
| Attribute | Description |
|---|---|
|
Specify true to enable the self monitoring functionality for Prometheus. |
|
The frequency (period of time) at which the system fetches (scrapes) data from a target source. |
To access the RESTCONF API that corresponds to this CLI, click
here.
Example:
The following CLI commands enable the self-monitoring capability for the time-series database. The self monitoring is enabled by specifying 'true'. The scrape-interval is defined as 10s. It means the metrics are collected every 10 seconds.
set time-series self-monitoring enable true
set time-series self-monitoring scrape-interval 10s
Example:
{
  "rtbrick-config:self-monitoring": {
    "enable": "true",
    "scrape-interval": "10s"
  }
}
Enabling Append-Timestamp in Prometheus
RBFS supports 'append-timestamp' functionality in Prometheus. When the append-timestamp flag is set, the first metric generated after an object is updated will include the actual timestamp of the update. This accurately reflects when the change took place. For all subsequent metrics for the same object (since it has not been been updated again) the current scrape time will be used.
You can enable append-timestamp on both metric or metric profile level. If you configure append-timestamp for both, metric-level gets priority.
Syntax:
| Attribute | Description |
|---|---|
|
Name of the metric. |
|
Name of the metric profile. |
|
Specify true to enable time-stamp functionality. |
Example command:
The following command is used to add a timestamp to each metric associated with the metric profile called 'chassis'.
set time-series metric-profile chassis append-timestamp true
Example:
{
  "rtbrick-config:metric-profile": [
    {
      "profile-name": "chassis",
      "append-timestamp": "true"
    }
  ]
}