The time-series database (TSDB)
Module Introduction
It is important from both operation and planning point of view to be able to collect meaningful operational values (or metrics) from network elements, and track their evolution over time.
Some typical examples are:
-
Tracking the received power level of optical interfaces, to detect early indications of signal degradation (e.g. due to optics degradation)
-
Tracking memory utilization on each node, to be able to detect memory exhaustion before it can cause any operational impact
-
Monitoring environmental parameters such as temperature and voltages, to detect problem with airflow or power supplies
This capability is especially useful if coupled with a mechanism to generate alerts when anomalies are detected.
As scale grows, it is also crucial to be able to aggreate collected metrics from multiple switches, to get an overall picture of the state of the network.
Some possible examples of aggregated metrics could be:
-
The number of errors or discarded packets on a fabric, typically expressed as a rate (that is, errors per time period)
-
The maximum utilization among all links of a network fabric over an interval.
To address this need, RBFS includes the possibility of running locally the Prometheus open-source montoring and alerting software.
This component includes:
-
A time-series database, where collected, time-stamped data can be stored
-
An alerting subsystem that allows to notify operators of metric changes that need attention
-
A federation mechanism that allows selected metrics to be collected from each node and aggregated by a central server
This functionality is inactive by default, but can be enabled from configuration.
Enabling the RTFS time-series database (TSDB) involves these steps:
-
Configuring one or more metrics (that is, specify what needs to be observed and collected)
-
Configuring a metrics profile that specifies how often the metric is to be collected
Once a metric is defined and collected, we can create alerts on them. This means:
-
Defining alerts, that is, define the conditions on the collected values that should trigger an alert
-
Defining alert profiles, which allow an operator to aggregate multiple alerts and specify how often to re-send the alert if still active.
To see this in action, we will follow the steps above, define a simple metric and associate an alert condition to its values.
Before you start the hands-on part of this module, you should load the appropriate configuration and verify that the testbed is up and running by executing the corresponding robot file:
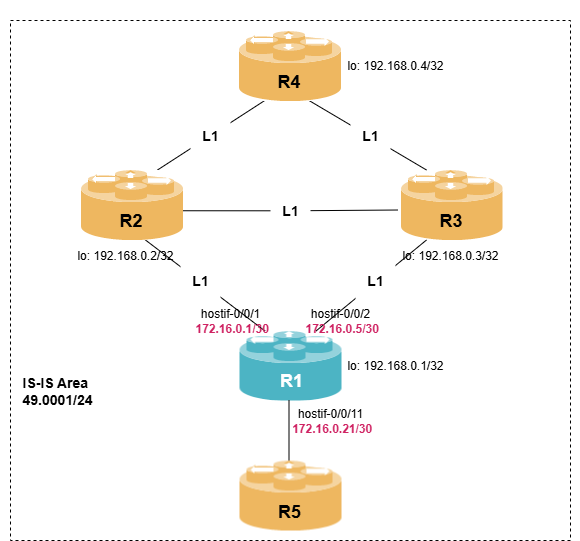
student@tour:~/trainings_resources/robot$ robot tsdb/tsdb_setup.robotTo test the time-series database we will use a simple EBGP setup where about 50 routes are announced by an upstream ISP; we will configure metric collection on R1.
Metrics
Metrics can be of two main types: object metrics and index metrics.
We will first define a simple object metric, and associate a profile to it so that it can be collected. Then we will show index metrics, which are slighly less intuitive to configure, but are useful when the values you are interested in are not attributes in a table, but properties of the table itself, such as the number of uninque entries in it.
Defining a simple object metric
Object metrics are defined on values of one or more attributes present on rows on the RTB datastore tables; we will use this type of metric in our first example.
Object metrics values can be of two separate datatypes:
-
counter: used for increasing numerical values (for example, the number of packets transmitted out of an interface, or the number of errors on a link), where we are typically interested in the rate of change (the difference between values over time)
-
gauge: they reflect numerical values that can either increase or decrease (for example, the temperature of a component, the speed of a fan on the switch chassis or the cpu utilization at a given instant).
Suppose for example that we are interested in tracking memory utilization on our node; this information is managed by the process resmond, in the table global.chassis_0.resource.mem_usage.
Use the show datastore resmond table global.chassis_0.resource.mem_usage to see which attributes are present in the global.chassis_0.resource.mem_usage table, and how many rows are in the table.
Click to reveal the answer
cfg> show datastore resmond table global.chassis_0.resource.mem_usage
Object: 0, Sequence: 9007, Last update: Fri Jul 03 10:36:44 GMT +0000 2026
  Attribute                                               Type                           Length     Value
  mem_id (1)                                              string (9)                          4     RAM
  total_mem (2)                                           uint64 (5)                          8     16082188
  used_mem (3)                                            uint64 (5)                          8     710876
  free_mem (4)                                            uint64 (5)                          8     15082056
  shared_mem (5)                                          uint64 (5)                          8     47536
  buffer_mem (6)                                          uint64 (5)                          8     0
  cached_mem (7)                                          uint64 (5)                          8     289256
  available_mem (8)                                       uint64 (5)                          8     15371312
Object: 1, Sequence: 9008, Last update: Fri Jul 03 10:36:44 GMT +0000 2026
  Attribute                                               Type                           Length     Value
  mem_id (1)                                              string (9)                          5     SWAP
  total_mem (2)                                           uint64 (5)                          8     0
  used_mem (3)                                            uint64 (5)                          8     0
  free_mem (4)                                            uint64 (5)                          8     0
From the output we can see that the table contains two objects, one with mem_id equal to RAM (the actual physical memory) and one where mem_id is SWAP, for swap memory. We will use a filter statement to select only the table row where mem_id equals to RAM. Within this table, we will monitor the attributes available_mem and used_mem.
you might have noticed also an attribute called free_mem, but that is not relevant for our purpose: it excludes temporary buffer memory that can be reclaimed when needed. The available_mem attribute instead reports the actual amout of RAM that is available to processes.
|
So to define this metric, we will need to configure:
-
The timeseries name; for example, we can use ram_usage_summary
-
The table where the data we are interested in is stored in BDS (in this case,
global.chassis_0.resource.mem_usage) -
The type of timeseries - in this case
object, as we are interesed in the attribute of a specific object (or row) in the table. -
The datatype of its value,
counterorgauge. In this case,gauge. -
A
filterstatement that select only the object withmem_id=RAM, ignoring SWAP memory. -
Finally, the attributes which we need to monitor (available_mem and used_mem). We will need to define a label called "name" with values "available" and "used", so we can store and query these two attributes separately in the internal time-series database.
The final metric configuration should look similar to this:
set time-series metric ram_usage_summary table-name global.chassis_0.resource.mem_usage
set time-series metric ram_usage_summary bds-type object-metric
set time-series metric ram_usage_summary prometheus-type gauge
set time-series metric ram_usage_summary description "Memory usage summary"
set time-series metric ram_usage_summary filter mem_id match-attribute-value RAM
set time-series metric ram_usage_summary filter mem_id match-type exact
set time-series metric ram_usage_summary attribute available_mem label name label-value available
set time-series metric ram_usage_summary attribute available_mem label name label-type static
set time-series metric ram_usage_summary attribute used_mem label name label-value used
set time-series metric ram_usage_summary attribute used_mem label name label-type staticOn node R1, enter switch-mode config and configure the metric ram_usage_summary using the configuration shown above.
Once the configuration is committed, verify the current values with the command show time-series metric ram_usage_summary.
Click to reveal the answer
After committing the configuration you should see the last sample, consisting of two values, one with name=available and one with name=used.
cfg> show time-series metric ram_usage_summary
Metric: ram_usage_summary

  Value: 715748 sampled at 03-JUL-2026 11:18:37
  Labels:
    bd_name                       : resmond
    element_name                  : R1
    instance                      : localhost:11012
    job                           : bds_default
    name                          : used
    pod_name                      : rtbrick-pod

  Value: 15366440 sampled at 03-JUL-2026 11:18:37
  Labels:
    bd_name                       : resmond
    element_name                  : R1
    instance                      : localhost:11012
    job                           : bds_default
    name                          : available
    pod_name                      : rtbrick-pod
The collection interval for a metric can be set by defining its metric-profile. If you do not define one, a default profile will be automatically associated with your metric; at the moment, the default collection inteval is set to 5 seconds.
|
Defining an index metric
Unlike object metrics, index metrics do not track attributes of objects in a table; they monitor properties od the index (or indexes) used to access them.
Their most frequent application is counting the number of objects in a table, via the index attribute active-entry-count.
Let’s consider for example the table that stores the set of active IPv4 routes in the default instance, that is, the routes actually installed and used to forward IPv4 packets: the table default.ribd.fib-local.ipv4.unicast
Try running the command show datastore ribd table default.ribd.fib-local.ipv4.unicast, just to get some insight on how routes are stored internally.
Click to reveal the answer
cfg> show datastore ribd table default.ribd.fib-local.ipv4.unicast
Object: 0, Sequence: 691, Last update: Tue Jul 07 13:05:07 GMT +0000 2026
  Attribute                                               Type                           Length     Value
  prefix4 (10)                                            ipv4prefix (13)                     5     172.16.0.1/32
  priority (19)                                           uint8 (2)                           1     High
  source (42)                                             uint8 (2)                           1     direct
  sub_src (43)                                            uint8 (2)                           1     Host
  nexthop_key (57)                                        payload (8)                        24     d39face8c44cecf72f8bd5fea2d4ba238c4028cc5d9f59c3
  preference (72)                                         uint32 (4)                          4     0
  bcm_status (113)                                        uint8 (2)                           1     None
  return_code (114)                                       uint32 (4)                          4     0
  vpp_status (115)                                        uint8 (2)                           1     None
  route_status (116)                                      uint32 (4)                          4     |-|-|-|-|-|-|-|-|-|-|-|-|-|-|-|-|-|-|-|-|-|-|-|-|-
  import_rt_type (188)                                    uint8 (2)                           1     intra-instance
  src_tbl_id (189)                                        uint16 (3)                          2     96
...
It is interesting from operations point of view to monitor the size of this table in the table, for example to prevent resource issues (that is, to make sure the number of active routes is well within the system hardware capabilities), or to detect unexpected changes such as a sudden increase or drop of the number of active routes.
To do this, we will need to monitor the number of active entries in this table, and this is the typical application of an index metric.
First let’s check which indexes are defined on the default.ribd.fib-local.ipv4.unicast table.
Use the show datastore ribd table default.ribd.fib-local.ipv4.unicast summary to check which indexes are available on the table.
Pay special attention to the Index column, which holds the index name, and the Active column, which holds the number of active entries in the index.
Click to reveal the answer
cfg> show datastore ribd table default.ribd.fib-local.ipv4.unicast summary
Table name: default.ribd.fib-local.ipv4.unicast Maximum-sequence: 767 Table ID: 96
  Index                                            Type                 Active   Obj Memory   Index Memory
  sequence-index                                   bds_rtb_bplus            71         9 KB           7 KB
  gc-index                                         bds_rtb_bplus             0         0 KB           0 KB
  primary                                          radix                    71         9 KB           7 KB
  nh_rib_map_index                                 libtrees-bplus           71         9 KB           7 KB
The primary index (of type radix) is used to do longest-prefix lookup on the IPv4 routing table, and is a good candidate for our metric: the active-entry-count of this index will match the number of active IPv4 unicast routes.
Now we have all information we need, and we can define our index metric on the default.ribd.fib-local.ipv4.unicast table.
If we name our metric ipv4_unicast_routes, the configuration should look similar to this:
set time-series metric ipv4_unicast_routes
set time-series metric ipv4_unicast_routes table-name default.ribd.fib-local.ipv4.unicast
set time-series metric ipv4_unicast_routes bds-type index-metric
set time-series metric ipv4_unicast_routes prometheus-type gauge
set time-series metric ipv4_unicast_routes index-name primary
set time-series metric ipv4_unicast_routes description "Number of active IPv4 routes in the default instance"
set time-series metric ipv4_unicast_routes attribute active-entry-count
commitDefine the ipv4_unicast_routes index metric with the parameters above, and commit the configuration.
Verify that the metric is configured and its actual value with show time-series metric ipv4_unicast_route.
Finally, verify that the reported value is correct by comparing it with the output of show route ipv4 unicast instance default summary.
Click to reveal the answer
cfg> show time-series metric ipv4_unicast_routes
Metric: ipv4_unicast_routes

  Value: 71 sampled at 07-JUL-2026 13:21:28
  Labels:
    bd_name                       : ribd
    element_name                  : R1
    instance                      : localhost:5512
    job                           : bds_default
    pod_name                      : rtbrick-pod

cfg>  show route ipv4 unicast instance default summary
Instance: default
  Source                 Routes
  arp-nd                      3
  bgp                        54
  direct                      7
  isis                        6
  static                      1
  Total Routes               71
Accessing the Prometheus Web Interface
Since the Prometheus time-series database is registered to the CtrlD control daemon, we can access its web interface with it.
Try using a web browser to connec to the URL below, making sure to replace [VM_ADDRESS] with the actual IPv4 address of your training virtual machine.
http://[VM_ADDRESS]:19091/api/v1/rbfs/elements/R1/services/prometheus/proxy/config
| Your browser may warn you that the connection is not secure, due to the use of unencrypted http; you can safely ignore this warning - we will not be entering any confidential information in the web interface during this training. |
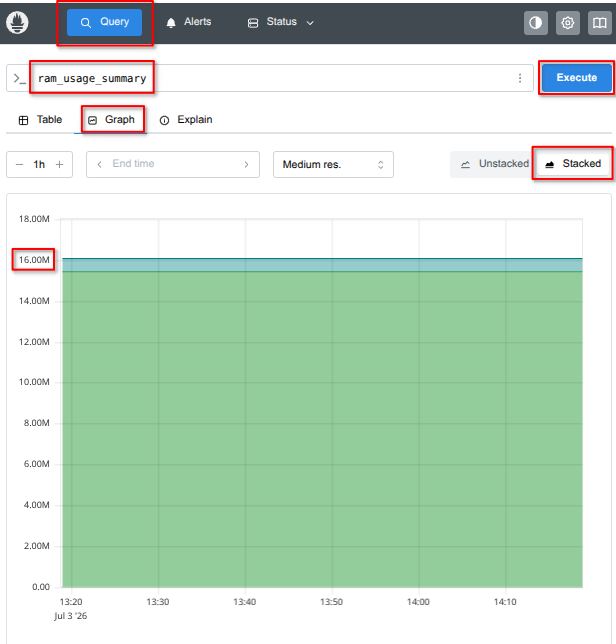
To try out the interface, we can use a simple query on one of the metrics we just defined. If you are not familiar with the Prometheus interface, you can follow these steps:
-
Type
ram_usage_summaryin the query field. -
Click on the Graph tab, immediately below the query field.
-
Click on the tab named Stacked, on the right side of the interface.
-
Finally, click the 'execute' button to display the graph.
This will display your memory usage, with the 'used' and 'available' memory values stacked on top of each other, in different colors, so that you can clearly see their ratio. The sum of the two will be the total memory available to R1.
Try to access the Prometheus interface, then run the query described above. How much memory does your VM have, and how much is being used at the moment?
Click to reveal the answer
Here is an example of the Prometheus interface, with the relevant elements highlighted in red. On this machine, the total amount of memory is 16 GB - the sum of the available and used memory values. Hovering the mouse over the graph will display the additional Prometheus labels for each value.
You can use this interface to query and experiment with your own metrics.
Alerts
Up to now we have seen how we can define metrics. The next step is to define alerts and alert conditions, to notify network operation teams of potential issues that need to be investigated if collected metric values deviate from their normal values.
Finally, we will see how alerts can be grouped together, and how you can specify the interval at which active alerts need to be re-sent to prevent them from being missed.
Defining alerts on metrics
Once metrics are defined and are being collected, it is possible to define alerts triggered by conditions on their values.
An alert configuration contains, among other things:
-
An expression, in the PromQL language, describing the conditions that trigger the alert
-
A duration, specifying the time the condition needs to be true in order to trigger the alert. This is useful in order to suppress transient conditions, if desired.
-
An interval, that specifies how often the triggering expression is evaluated
-
An alert group, which can be used to aggregate alerts
-
Metadata such as a description, a summary and annotations
-
A label, which are name-value pairs that can be used to categorize alerts and map them to alert profiles
it is useful to define a label repeat_interval with value that express a duration, and use this label to associate an alert profile where the actual duration is specified. Alert profiles will be discussed later on this guide.
|
To see this in action, we will configure a simple alert based on one of the metrics we just defined, ipv4_unicast_routes.
Note that with the Prometheus Query Language you can express complex conditions such as on rate of changes (to spot sudden increases or drops), or even condition that involve multiple variables (such as the memory utilization per broadband subscriber).
Here we will show a much simpler example: an alert named less_than_50_routes, that is fired if the number of active IPv4 routes drops below 50 in a 15-second interval. We can assign a severity level of 2 (critical) to this event, and attach to it a label repeat_interval with a value of 10m, which we will use later on when we define the alert-profile. Finally, we will request the conditions to be re-evaluated every 5 seconds, matching the default scrape interval.
The alert configuration should look similar to this:
set time-series alert less_than_50_routes
set time-series alert less_than_50_routes group routing
set time-series alert less_than_50_routes for 15s
set time-series alert less_than_50_routes interval 5s
set time-series alert less_than_50_routes expr "ipv4_unicast_routes < 50"
set time-series alert less_than_50_routes level 2
set time-series alert less_than_50_routes summary "Less 50 IPv4 active routes"
set time-series alert less_than_50_routes description "Less 50 IPv4 active routes are in the forwarding table"
set time-series alert less_than_50_routes labels repeat_interval:10m
commitConfigure the less_than_50_routes alert as described above. Then, commit the configuration.
Check the current number of ipv4_unicast_routes with show time-series metric ipv4_unicast_routes; is it above the threshold of 50?
Confirm that no alert are firing by using the command show time-series alert.
Click to reveal the answer
The number of active routes should be about 70, of which ~50 are BGP routes announced by the BGP peer named ISP
cfg> show time-series metric ipv4_unicast_route
Metric: ipv4_unicast_routes

  Value: 71 sampled at 07-JUL-2026 13:25:51
  Labels:
    bd_name                       : ribd
    element_name                  : R1
    instance                      : localhost:5512
    job                           : bds_default
    pod_name                      : rtbrick-pod

cfg> show bgp peer
Instance: default
  Peer                                     Remote AS    State         Up/Down Time               PfxRcvd              PfxSent
  R2                                       64500        Established   0d:00h:20m:35s             1                    56
  R3                                       64500        Established   0d:00h:20m:32s             1                    56
  R4                                       64500        Established   0d:00h:20m:32s             0                    56
  ISP                                      64501        Established   0d:00h:20m:45s             54                   58
Unsurprisingly, since the number of active routes is above 50, no alerts are firing:
op> show time-series alert
State       Since                  Level        Summary
To simulate a failure and trigger the alarm, we can disable the interface hostif-0/0/11, where the BGP peer named ISP is connected.
set interface hostif-0/0/11 admin-status down
commit
After committing, let’s verify the state of alarms by running show time-series alert.
Remember the condition is triggered after 15 seconds; you should see the alert quickly transitioning to pending (the trigger condition is evaluating to TRUE) and then firing (the condition has been true for more than 15 seconds).
cfg> show time-series alert
State       Since                  Level        Summary
pending     07-JUL-2026 13:28:11   Critical     Less 50 IPv4 active routes

supervisor@R1>rtbrick: cfg> show time-series alert
State       Since                  Level        Summary
firing      07-JUL-2026 13:28:11   Critical     Less 50 IPv4 active routes
You can get the details of any of the active alarms by specifying their name; this will also tell you when the alarm was first fired:
cfg> show time-series alert less_than_50_routes
Alert: less_than_50_routes
Firing since 07-JUL-2026 13:28:11
Level: Critical
Summary: Less 50 IPv4 active routes
Description: Less 50 IPv4 active routes are in the forwarding table
Labels:
  alertname                     : less_than_50_routes
  bd_name                       : ribd
  element_name                  : R1
  instance                      : localhost:5512
  job                           : bds_default
  pod_name                      : rtbrick-pod
  repeat_interval               : 10m
Annotations:
  description                   : Less 50 IPv4 active routes are in the forwarding table
  level                         : 2
  summary                       : Less 50 IPv4 active routes
Alert profiles
Alert profiles allows to group several alerts and specify how often notifications should be re-sent if the alert condition persists.
As an example, you could define a profile called hadware-alert that groups several individual alerts that indicate potential hardware issues (for example temperature, fans or power supply issues); once the network operation team has been advised of this, they can then check and troubleshoot the specific problem.
Similarly, you could consider grouping alerts related to individual switch resources (e.g. excessive CPU usage, high memory utilization or low disk space) into a resource-alert group, to warn about issues that could potentially lead to resource exhaustion. Alerts can then be relayed via the CtrlD process to external Network Faut Management Systems, to notify the network operation team of the potential issue before it has any actual impact.
Alert profiles are configured under the time-series configuration hierarchy, and are associate to alerts via the labels attached to each alert.
The real usefulness of alert-profiles is the capability to group alerts to simplify their management; but, just as an example, we can configure a simple alert profile associated to the isis_below_three alert we defined above, and request that the alert is re-sent every 10 minutes if active:
set time-series alert-profile every_10_mins
set time-series alert-profile every_10_mins priority 2
set time-series alert-profile every_10_mins repeat-interval 10m
set time-series alert-profile every_10_mins matchers repeat_interval=10m
The matchers statement is what ties the alert profile to the alert, via the repeat_interval alert label.
Configure the every_10_mins alert with the parameters described above.
Commit the configuration and use the show time-series alert-profiles.
Click to reveal the answer
set time-series alert-profile every_10_mins
set time-series alert-profile every_10_mins priority 2
set time-series alert-profile every_10_mins repeat-interval 10m
set time-series alert-profile every_10_mins matchers repeat_interval=10m
commit
Enabling TSDB self-monitoring
Up to now, we have been defining metrics and alerts based on values in the Rtbrick Datastore, that is, on the state of network elements. In this last exercise, we will enable monitoring on the state of the Prometheus monitoring subsystem itself; this will allow us to detect error conditions that could potentially affect metric collection and alerting.
Since Prometheus health metrics are themselves stored in the time-series database, you need to specify how often they are collected (i.e. the scrape-interval).
Once we do this, we will also be able to see statistics about the actual metrics being collected.
You can enable self-monitoring with this configuration:
set time-series self-monitoring enable true
set time-series self-monitoring scrape-interval 30s
commit
After doing this you should be able to see the list of configured metric profiles and counters for the different Prometheus error conditions using the command show time-series statistics
Remember that after committing you need to wait for 30 seconds in order for the first collection run to populate the database and show error and status counters.
Configure self-monitoring using the configuration described above.
Commit the configuration, then use show time-series statistics to check status and error counters.
Remember that the counters will be visible only after about 30 seconds.
Click to reveal the answer
set time-series self-monitoring enable true
set time-series self-monitoring scrape-interval 30s
Running the show time-series statistics immediately shows only the metric profile, as the actual database entries will be created only after the first collection run:
cfg> show time-series statistics
Scrape Targets
Metric Profile                       Daemons
default                              2

No time-series database entry for prometheus_target_scrapes_sample_duplicate_timestamp_total found.
No time-series database entry for prometheus_target_scrapes_exemplar_out_of_order_total found.
No time-series database entry for prometheus_target_scrapes_sample_out_of_bounds_total found.
No time-series database entry for prometheus_target_scrapes_sample_out_of_order_total found.
No time-series database entry for prometheus_target_scrapes_exceeded_sample_limit_total found.
No time-series configured or time-series database not responding.
Waiting ~30 seconds shows both absoulte counters and the error rate on a 5-minute interval
cfg> show time-series statistics
Scrape Targets
Metric Profile                       Daemons
default                              2

Error Counters
Name                                                               Count       Increase (in last 5 mins)
prometheus_target_scrapes_sample_duplicate_timestamp_total         0           0
prometheus_target_scrapes_exemplar_out_of_order_total              0           0
prometheus_target_scrapes_sample_out_of_bounds_total               0           0
prometheus_target_scrapes_sample_out_of_order_total                0           0
prometheus_target_scrapes_exceeded_sample_limit_total              0           0
In addition to this, if you try the CLI command show time-series metric followed by the question mark ?, you will see another metric called rtbrick_invalid_metric_config has been automatically created to collect Prometeus errors.
Module Summary
In this short introduction to the time-series database and alerting, we:
-
Described some possible uses of the built-in time-series database (TSDB)
-
Defined step-by-step a simple object metric and an index metric
-
Configure alert and alert-profiles on our sample metrics
-
Finally, we enabled self-monitoring to check the health of the Prometheus process itself
While these examples are (for brevity and clarity) very simple, they should serve as an initial foundation to build more complex metric which are specific to your actual operational requirements.
For more information on the time-series database, please refer to the documentation.