Introduction
Operational-state visibility is key for troubleshooting, testing, monitoring and capacity management. This requires to sample router metrics periodically. Ingestion of time-series data allows to ask interesting operational queries.
Examples:
-
A slightly increasing memory consumption over time while overall PPPoE session count has not changed, for example, is an indication for a memory leak.
-
If the 5 Minute chassis temperature is too high, this might be an indication for an imminent hardware breakdown and the switch hardware must be replaced.
-
If utilization of all fabric interfaces is constantly touching the 80% saturation levels then new fabric links must be commissioned.
-
High input traffic with degradation of optical receive levels might be an indication of running very close to optical budget.
The challenge is to sample all these information efficiently in terms of disk, memory and CPU utilization while providing comprehensive query and reporting functionality.
Supported Platforms
Not all features are necessarily supported on each hardware platform. Refer to the Platform Guide for the features and the sub-features that are or are not supported by each platform.
Architectural Overview
The RBFS telemetry architecture is based on Prometheus as an open-source systems monitoring and alerting toolkit. Prometheus is designed to pull metrics periodically, and save them efficiently. It allows to analyze the metrics with a powerful query language called PromQL. Also an optional alert management is available. There is opportunity to tie it together with own services to integrate it into the system landscape. Data should have short retention times (default 15d).
This fits perfectly to the needs in BDS. The figure below shows how it fits in an overall architecture.
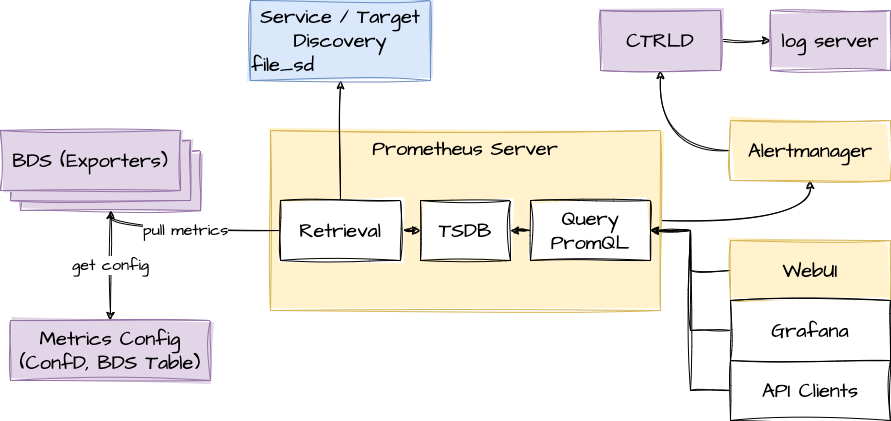
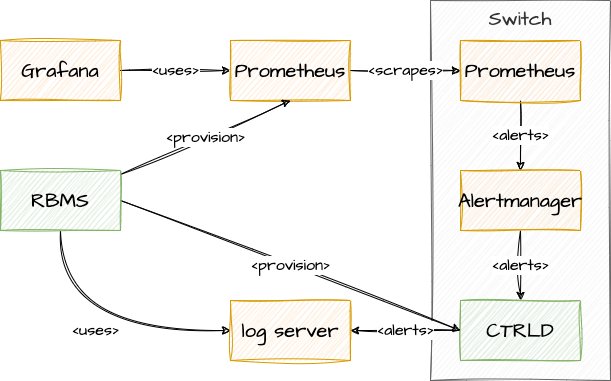
To mitigate the short retention times, which fits to BDS but not in an overall telemetry process, the data can be stored in a centralized storage database (for example, Influx) this can be done by federation or via remote storage adapters. To distribute the alert messages from prometheus, CTRLD functions as "alertmanager webhook receiver", which takes the alert and distributes it to a log management tool.
Router deployment model
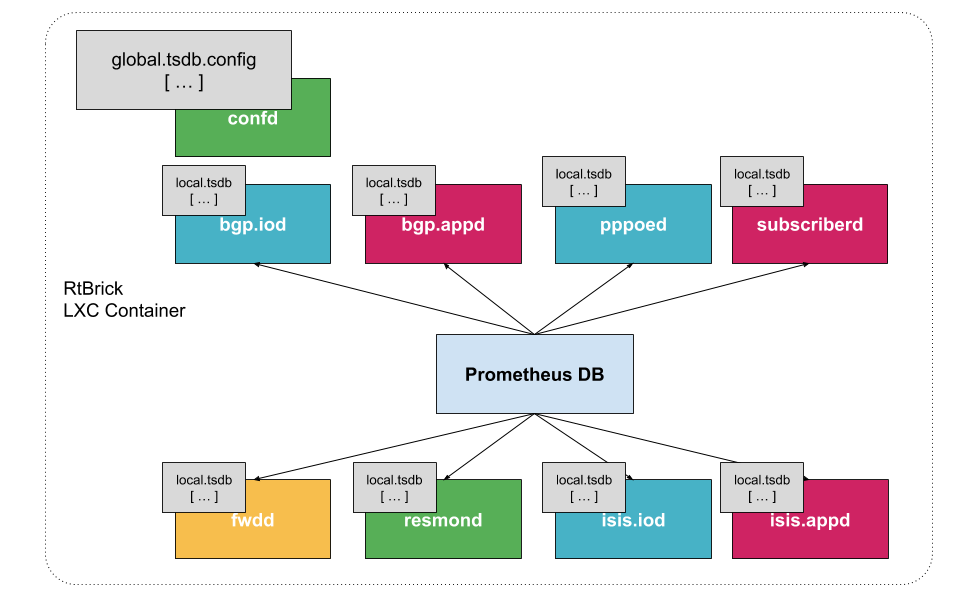
Prometheus DB is run on the router as a dedicated process. It ships with a package-time configuration to poll each BDS capable speaker at periodic intervals. Initially the periodic interval is 1 second. The Prometheus Exposition format is a very simple HTTP based GET query which asks a given BD speaker "Give me all your metrics". Each BD subscribes to the global.time-series.metric.config table, which contains an operator-configurable list of BDS targets. Only the BDS which is master of a table responds. Next Prometheus polls the BD using the /metrics URL.
Storage efficiency
On an average Prometheus uses only around 1-2 bytes per sample. Thus, to plan the capacity of a Prometheus server, you can use the rough formula:
needed_disk_space = retention_time_seconds * ingested_samples_per_second * bytes_per_sample
The single binaries disk space:
-rwxr-xr-x 1 root root 27M Sep 2 22:51 alertmanager +
-rwxr-xr-x 1 root root 81M Sep 2 22:51 prometheus +
-rwxr-xr-x 1 root root 49M Sep 3 19:55 promtool
Promtool is needed to test the configurations before set them to prometheus.
Alerting
The alerting is configured through Prometheus. For more information, see alertmanager.
Role of CTRLD
Figure-4 provides an overview of the role of CTRLD.
Prometheus and Alertmanager register themself in CTRLD, so that CTRLD is aware of these two services.
Service state and Proxy
The registration of the services gives 2 advantages:
-
The operational state is an indicator if the service is up and running.
-
The proxy functionality of CTRLD can be used for prometheus and alertmanager.
The proxy functionality is used for querying prometheus directly:
curl 'http://198.51.100.125:19091/api/v1/rbfs/elements/rtbrick/services/PROMETHEUS/proxy/api/v1/query?query=up' | jq .
But it is also used for federation and therefore the following URL is used:
http://198.51.100.125:19091/api/v1/rbfs/elements/rtbrick/services/PROMETHEUS/proxy/federate
Federation deployment model
Prometheus is intended to have at least one instance per datacenter usually; also with a global Prometheus for global graphing or alerting. Federation allows for pulling metrics and aggregations up the hierarchy.
In the global Prometheus config, this timeseries is pulled:
prometheus.yml:
global:
  scrape_interval: 60s # By default, scrape targets every 15 seconds.
  # A scrape configuration containing exactly one endpoint to scrape:
scrape_configs:
  - job_name: "federate"

    honor_labels: true
    metrics_path: '/federate'
    params:
      'match[]':
        - '{job="bds"}'
    scrape_interval: 15s
    # Patterns for files from which target groups are extracted.
    file_sd_configs:
      - files:
          - ./bds.target.yml
        refresh_interval: 5m
The match[] here requests all BDS job time series. By following this job naming convention, you do not have to adjust the config every time when there is a new aggregating rule.
The targets itself can be configured in a separate file.
bds.target.yml:
- targets: ['198.51.100.125:19091']
  labels:
    __metrics_path__: "/api/v1/rbfs/elements/rtbrick/services/PROMETHEUS/proxy/federate"
    box: 125_rtbrick