CPU Utilization
The second example measures the CPU utilization to outline how to work with counter metrics. Run rtb resmond show cpu usage to display the current CPU utilization.
$ rtb resmond show cpu usage
+--------+----------+----------+----------+----------+----------+----------+----------+----------+
 Name       Total      User       Sys        Nice       I/O-wait   Idle       IRQ        Soft-IRQ
+--------+----------+----------+----------+----------+----------+----------+----------+----------+
 cpu        4%         2%         2%         0%         0%         95%        0%         0%
 cpu0       1%         0%         1%         0%         0%         99%        0%         0%
 cpu1       16%        12%        4%         0%         0%         83%        0%         0%
 cpu2       3%         2%         0%         0%         0%         96%        0%         0%
 cpu3       10%        1%         9%         0%         0%         89%        0%         0%
 cpu4       2%         1%         1%         0%         0%         97%        0%         0%
 cpu5       4%         0%         4%         0%         0%         96%        0%         0%
 cpu6       3%         3%         0%         0%         0%         97%        0%         0%
 cpu7       0%         0%         0%         0%         0%         100%       0%         0%
+--------+----------+----------+----------+----------+----------+----------+----------+----------+
The CPU provides a set of counters to measure the CPU utilization in jiffies /3/. A jiffy is the duration of a software clock tick, which is platform-dependent. By that, a jiffy is neither a constant period of time nor very meaningful to a human, which is why the counter values need to be put into perspective.
First, it is important to measure the total CPU utilization to see how busy the switch is. Secondly, if the CPU utilization is considerably high, it is interesting to find out which processes cause the high CPU utilization. Both aspects are addressed in this tutorial.
The time spend in user and kernel space needs to be divided by the total amount of available processing time to compute the total CPU utilization:
total_cpu_utilization = (total_cpu_user_jiffy + total_cpu_sys_jiffy) / (total_cpu_total_jiffy)
where
-
total_cpu_user_jiffyis the total amount of time spent in user mode in a sampling interval, -
total_cpu_sys_jiffyis the total amount of time spent in kernel mode in a sampling interval and -
total_cpu_total_jiffyis the total amount of computing time available in a sampling interval.
The cpu_total_utilization value is dimensionless. The value range is between 0 and 1. It can be converted into percentage by being multiplied by 100%.
total_cpu_utilization_percentage = total_cpu_utilization * 100%
The process total load ratio expresses the ratio a process load to the total load:
proc_total_load_ratio = (proc_cpu_user_jiffy + proc_cpu_sys_jiffy) / (total_cpu_user_jiffy + total_cpu_sys_jiffy)
where
-
proc_cpu_user_jiffyis the process time spent in user mode in a sampling interval and -
cpu_sys_proc_jiffyis the process time spent in user mode in a sampling interval
The process_total_load_ratio value is dimensionless. The value range is between 0 and 1. It can be converted into percentage by being multiplied by 100%.
proc_total_load_ratio_percentage = proc_total_load_ratio * 100%
Sampling CPU Counters
The CPU counters are located in two different tables. The total CPU utilization can be sampled from the user_cpu_tick, sys_cpu_tick and total_cpu_tick attributes in the global.chassis_0.resource.cpu_usage table. This table contains the total counters but also counters per supported hardware thread (virtual core).
The JSON objects below enables CPU counter sampling for the three mentioned counters:
{
  "rtbrick-config:metric": {
    "name": "total_cpu_total_jiffy",
    "table-name": "global.chassis_0.resource.cpu_usage",
    "bds-type": "object-metric",
    "prometheus-type": "counter",
    "description": "Total CPU utilization in jiffies",
    "attribute": [
      {
        "attribute-name": "total_cpu_tick",
        "label": [
          {
            "label-key": "cpu",
            "label-value": "cpu_id",
            "label-type": "dynamic"
          }
        ]
      }
    ]
  }
}{
"rtbrick-config:metric": {
"name": "total_cpu_user_jiffy",
"table-name": "global.chassis_0.resource.cpu_usage",
"bds-type": "object-metric",
"prometheus-type": "counter",
"description": "Total user CPU utilization.",
"attribute": [
{
"attribute-name": "user_cpu_tick",
"label": [
{
"label-key": "cpu",
"label-value": "cpu_id",
"label-type": "dynamic"
}
]
}
]
}
}{
"rtbrick-config:metric": {
"name": "total_cpu_sys_jiffy",
"table-name": "global.chassis_0.resource.cpu_usage",
"bds-type": "object-metric",
"prometheus-type": "counter",
"description": "Total kernel CPU utilization in jiffies",
"attribute": [
{
"attribute-name": "sys_cpu_tick",
"label": [
{
"label-key": "cpu",
"label-value": "cpu_id",
"label-type": "dynamic"
}
]
}
]
}
}Computing Total CPU Utilization From Counter Samples
The Prometheus Query Language /2/ provides functions to work with counters and also allows to put time series into perspective.
| Some PromQL functions should be used for gauge metrics only others only for counter metrics. |
The PromQL queries below computes the total user, kernel and user + kernel CPU utilization:
rate(total_cpu_user_jiffy{cpu="cpu"}[60s])
/ rate(total_cpu_total_jiffy{cpu="cpu"}[60s])

rate(total_cpu_sys_jiffy{cpu="cpu"}[60s])
/ rate(total_cpu_total_jiffy{cpu="cpu"}[60s])

( rate(total_cpu_user_jiffy{cpu="cpu"}[60s])
  + rate(total_cpu_sys_jiffy{cpu="cpu"}[60s]) )
/ rate(total_cpu_total_jiffy{cpu="cpu"}[60s])
The rate function computes the delta between two sampled count values. The rate function is optimized for counters and can detect counter resets by being aware that a counter value always increases unless a reset has taken place. The rate function handles counter resets properly. The cpu label filters for the total count values for all virtual cores.
The PromQL query below computes the virtual core utilization:
( rate(total_cpu_user_jiffy{cpu!="cpu"}[60s])
  + rate(total_cpu_sys_jiffy{cpu!="cpu"}[60s]))
/ rate(total_cpu_total_jiffy{cpu!="cpu"}[60s])
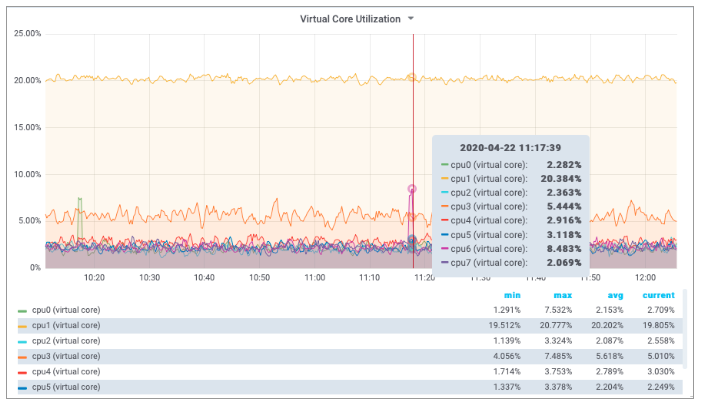
The cpu label identifies the virtual core. The BDS contains count values for each virtual core but also the total count over all virtual cores. The first dashboard queried the total count by filtering for cpu="cpu", whereas the second dashboards fetched the per virtual core counters by filtering for cpu!="cpu", i.e. by excluding the total count over all virtual cores from the result set.
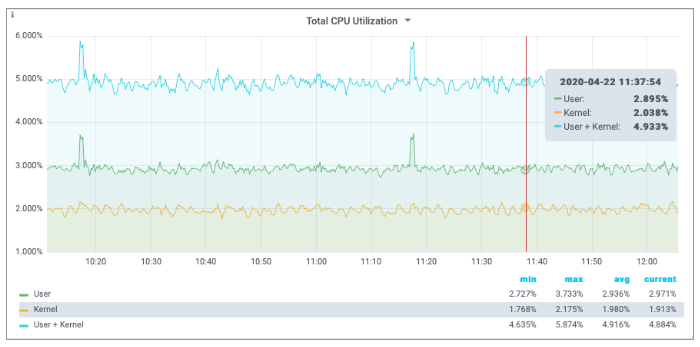
The screenshots below show Grafana dashboard panels to display the computed total CPU utilizations and the utilization of the virtual cores.
Sampling Process CPU Counters
The next step is to compute the per process CPU utilization. This requires to sample the process utilization counters of each process and put them into perspective of the total CPU counters.
The process CPU usage can be read from the cpu_user and cpu_sys attributes in the global.chassis_0.resource.proc_usage table. The process name can be read from the process_name attribute. The listings below configure user mode and kernel mode CPU utilization sampling per process:
{
    "rtbrick-config:metric": {
        "name": "proc_cpu_sys_jiffy",
        "table-name": "global.chassis_0.resource.proc_usage",
        "bds-type": "object-metric",
        "prometheus-type": "counter",
        "description": "Process kernel mode CPU utilization in jiffies",
        "attribute": [
            {
                "attribute-name": "cpu_sys",
                "label": [
                    {
                        "label-key": "process",
                        "label-value": "process_name",
                        "label-type": "dynamic"
                    }
                ]
            }
        ]
    }
}{
"rtbrick-config:metric": {
"name": "proc_cpu_user_jiffy",
"table-name": "global.chassis_0.resource.proc_usage",
"bds-type": "object-metric",
"prometheus-type": "counter",
"description": "Process user mode CPU utilization in jiffies",
"attribute": [
{
"attribute-name": "cpu_user",
"label": [
{
"label-key": "process",
"label-value": "process_name",
"label-type": "dynamic"
}
]
}
]
}
}Computing Process CPU Utilization From Counter Samples
The PromQL query puts the CPU counters of each process into perspective of the total CPU utilization.
( rate(proc_cpu_sys_jiffy[60s]) + rate(proc_cpu_user_jiffy[60s]) )
/ scalar(rate(total_cpu_total_jiffy{cpu="cpu"}[60s]))
The scalar function converts the one-dimensional total_cpu_total vector to a scalar to put the CPU process utilization into perspective.
| Prometheus differentiates between vectors and scalars. Algebraic operations between two vectors, like the addition of the proc_cpu_sys and the proc_cpu_user vectors above, require that both vectors have the same labels. Otherwise no data points are returned by Prometheus, because a built-in filter excludes all items with different labels from the computation. |
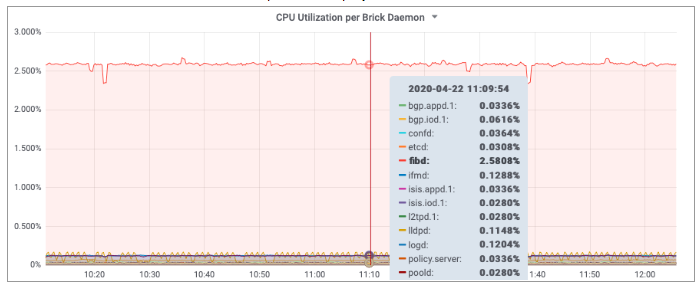
The screenshot below shows a Grafana panel to display the total CPU utilization of each brick daemon.