Grafana Dashboards
Grafana can visualize time series data from Prometheus /5/. Grafana can query the Prometheus instance on RBFS by using CTRLD as proxy:
http://<SWITCH_MGMT_IP>:19091/api/v1/rbfs/elements/rtbrick/services/PROMETHEUS/proxy/
The downside of this approach is that a Prometheus datasource needs to be created in Grafana for every switch. In addition, all dashboards must be created per switch too, because a dashboard panel can operate on a single datasource only. Fortunately, Prometheus can federate data from other Prometheus instances /6/. By that, all sampled metrics get accessible through a single Prometheus instance. In combination with Grafana dashboard variables, a dashboard can be configured to access all existing switches.
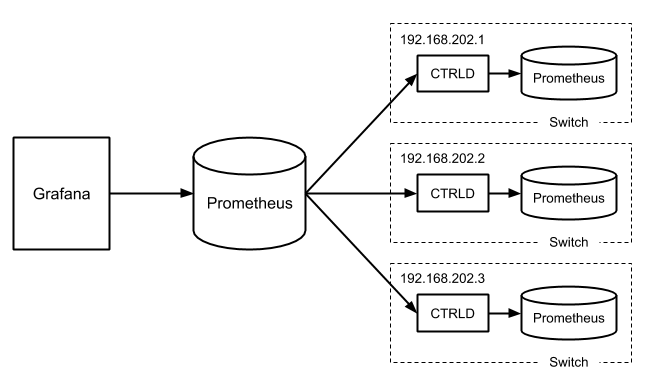
The federating Prometheus instance can assign new label names. This allows to assign a unique element_name label value, if the element name is not specified on the switches and defaults to rtbrick. The listing below shows an excerpt of the Prometheus configuration to federate data from other Prometheus instances.
scrape_configs:
- job_name: federate
  params:
    match[]':
    - '{job="bds"}'
  static_configs:
  - targets: ["192.168.202.1:19091"]
    labels:
      element_name: "l1.pod2"
      __metrics_path__: "/api/v1/rbfs/elements/rtbrick/services/PROMETHEUS/proxy/federate"
  - targets: ["192.168.202.2:19091"]
    labels:
      element_name: "s1.pod2"
      __metrics_path__: "/api/v1/rbfs/elements/rtbrick/services/PROMETHEUS/proxy/federate"
  - targets: ["192.168.202.3:19091"]
    labels:
      element_name: "bl1.pod2"
      __metrics_path__: "/api/v1/rbfs/elements/rtbrick/services/PROMETHEUS/proxy/federate"
The remaining step is to create a single datasource in Grafana to query the federated time series data.