Reporting Issues to RtBrick
If the described steps in the earlier sections do not provide enough information to resolve the issue, or if the collected data suggests that the system is not functioning as expected (for example, due to a suspected software bug), you can contact the Technical Assistance Center (TAC) at RtBrick for further support.
Opening a case
You can report issues by submitting a support ticket to RtBrick TAC team through Freshdesk. Contact with RtBrick must be initiated through a designated point of contact within your organization or team.
You must have an active business contract and a support account with RtBrick to open a support case.
Support Portal
To access RtBrick support portal:
Click Support Portal.
Or alternatively, visit the RtBrick website, in the Support drop-down menu, choose Fix A Problem. The Freshdesk login page appears.
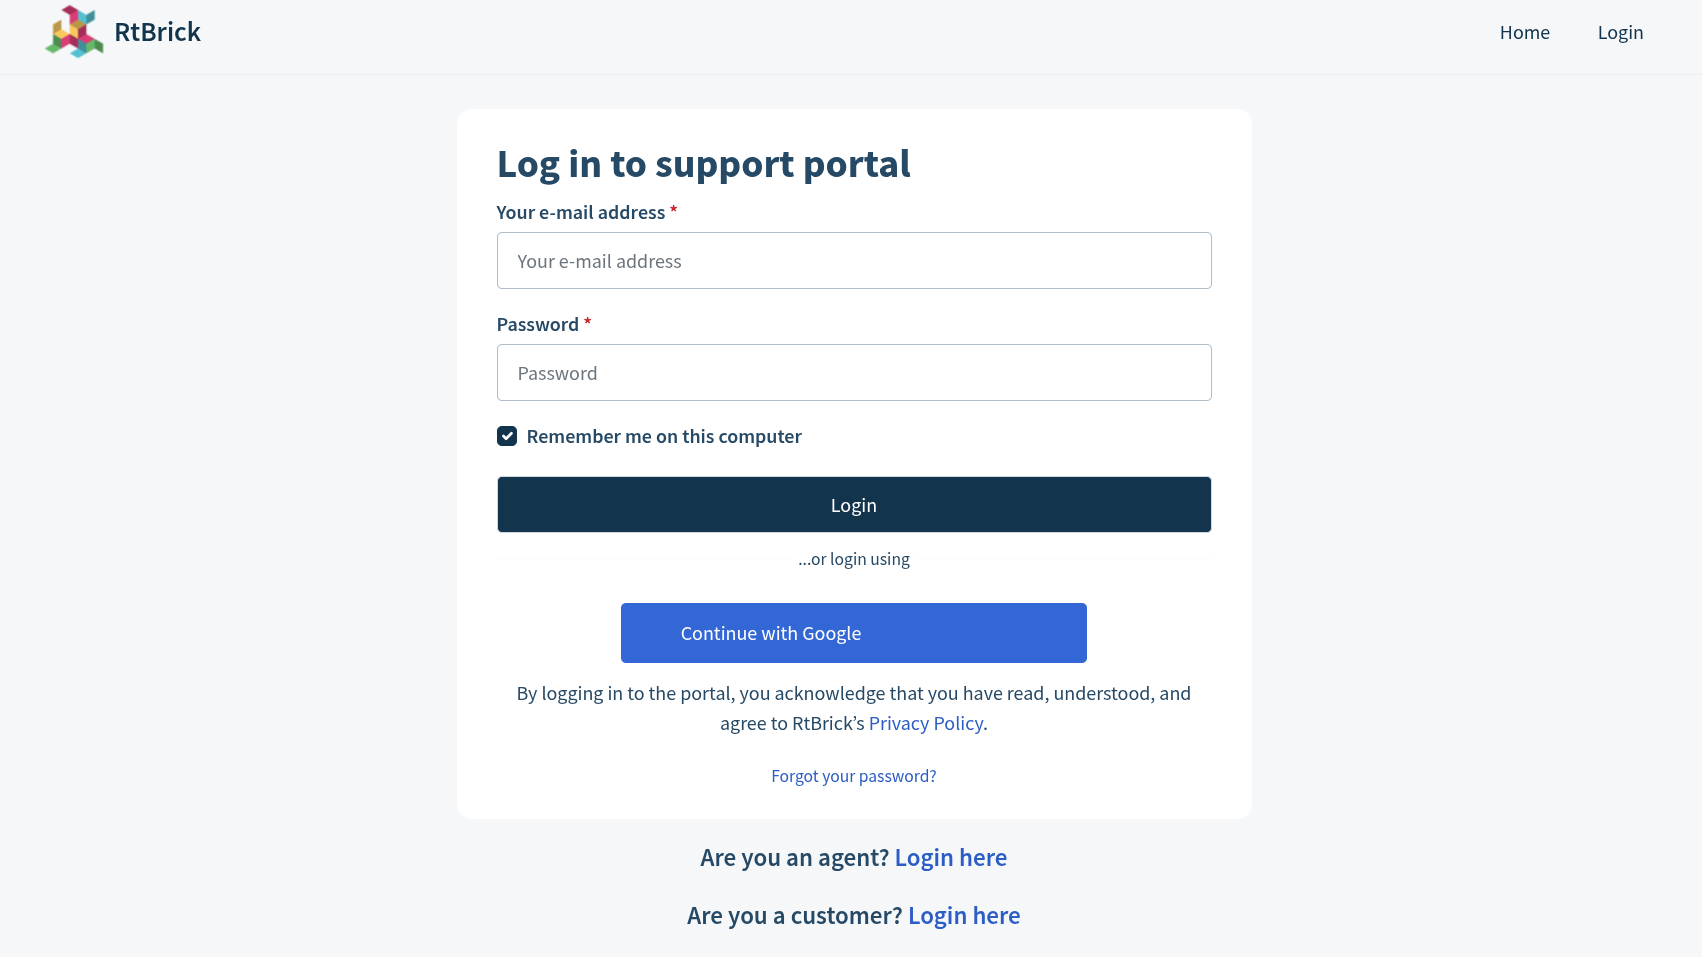
Log in to the support portal using your credentials.
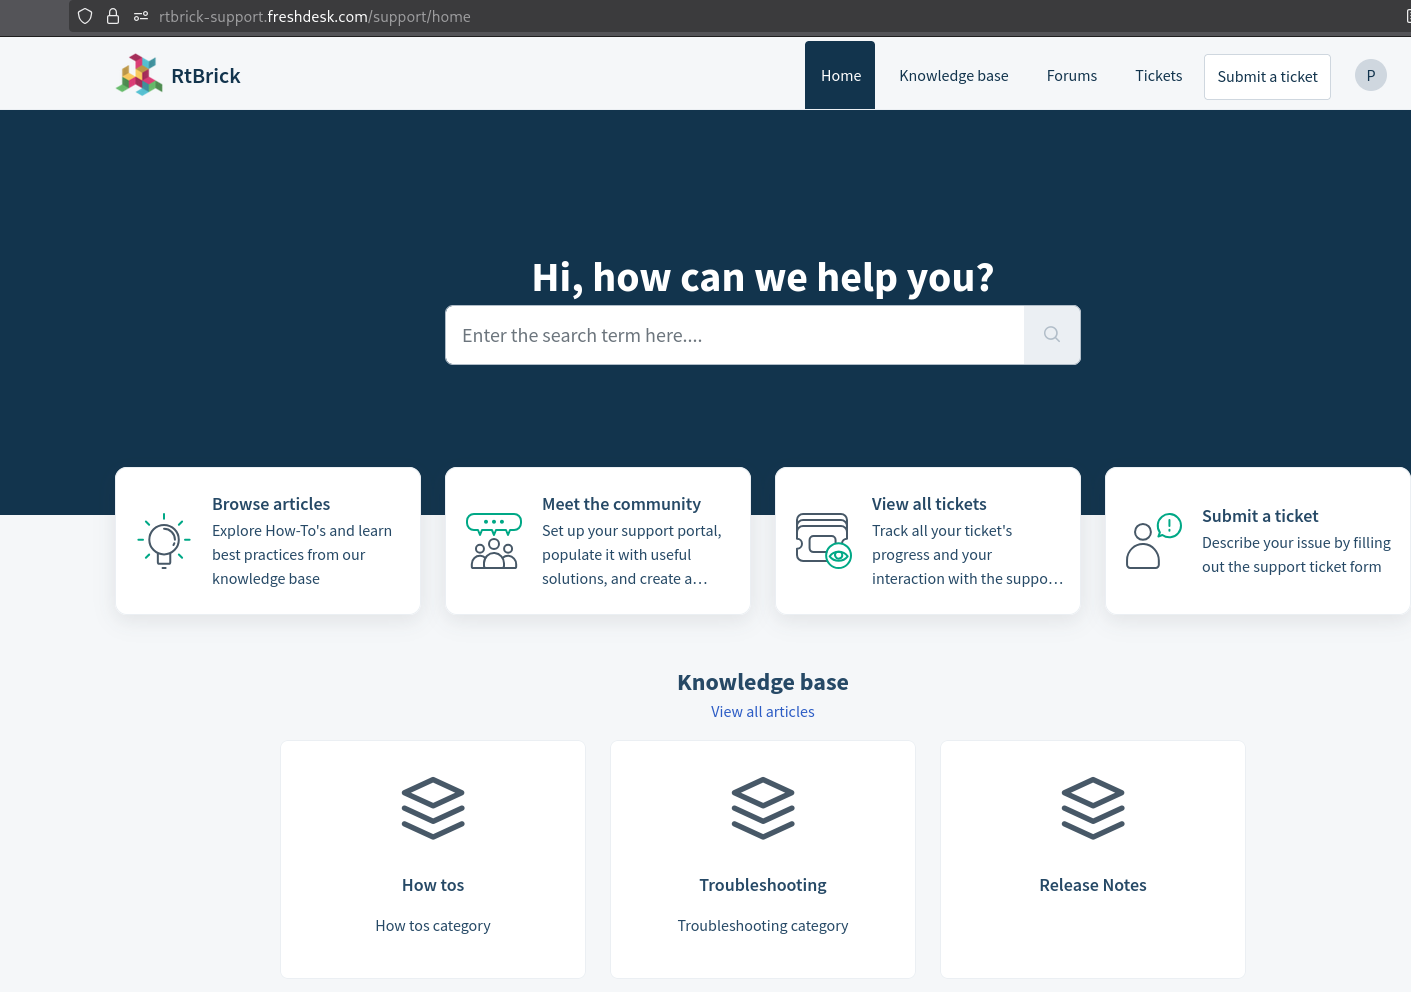
In the support page that appears, if you do not have any existing cases, you can view a form to open a case.
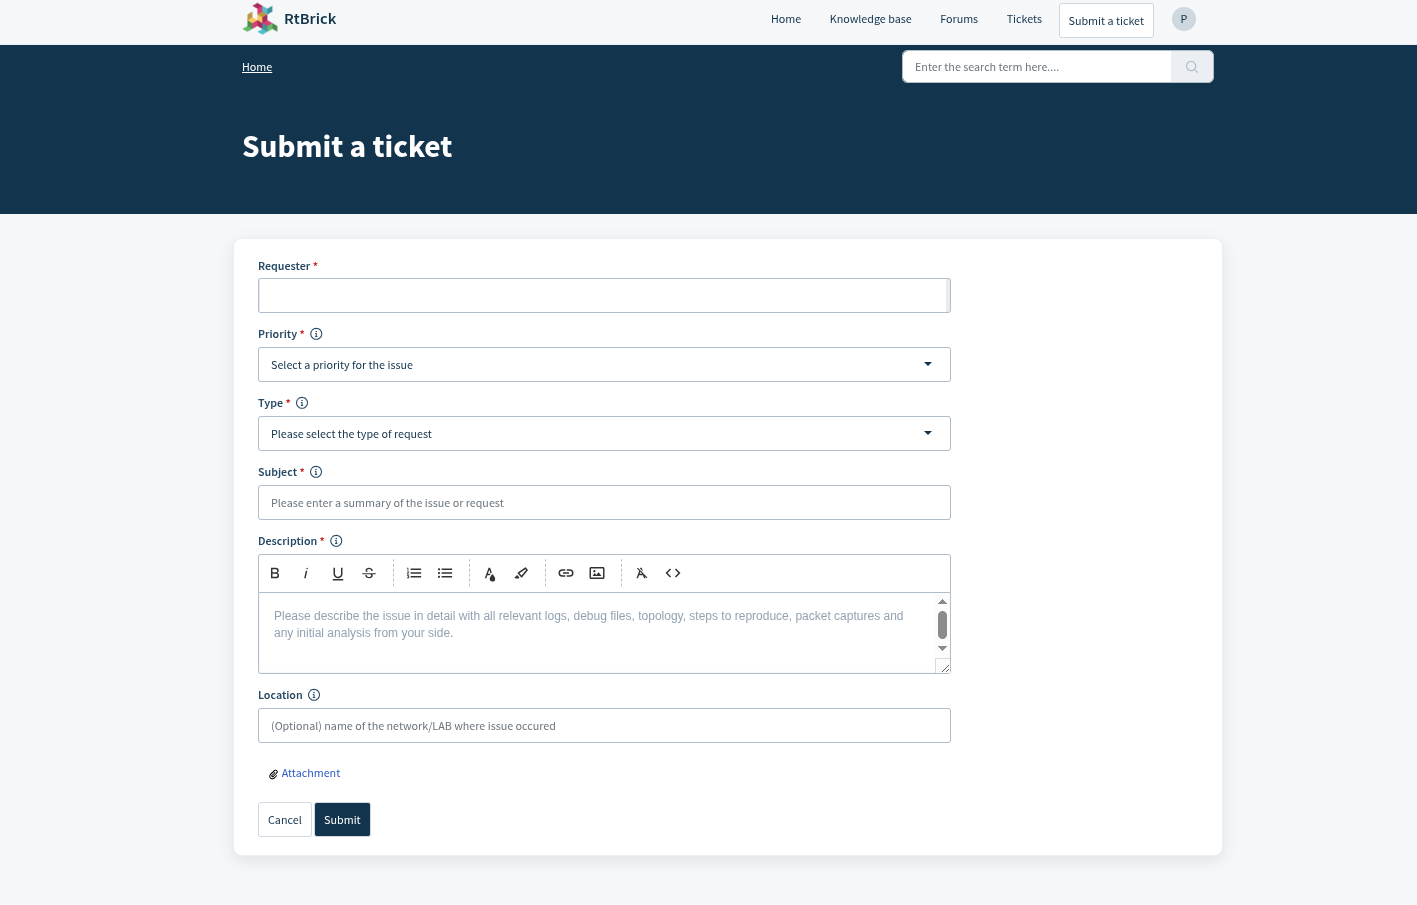
On the 'Home' page appears, click Submit a ticket. On the 'Submit a ticket' page, you must provide some information to pinpoint the issue encountered.
-
If the issue was encountered on a virtual installation or on a physical box.
-
The RBFS image role (spine/access leaf), the version, and the patch version.
-
Any logs and/or comments: for logs you can use the "Add attachment" link in the support page, and comments can be posted after the case is submitted.
The fields marked with an asterisk are mandatory.
After filling in the fields, Click Submit at bottom of the page.
Now the Freshdesk ticket with an ID has been generated.
Debugger Information Utility Program
In RBFS, every daemon maintains a set of tables containing data specific to its functions. These daemon-specific tables help in a deeper analysis of issues, allowing for targeted debugging based on the specific functions and responsibilities of each daemon.
RBFS implements a debugger information utility program. This utility allows you to retrieve table information from all or a few specific modules. This information also includes log files, diagnostic messages, CPU and memory states, and current and previous configurations. This utility program can be run whenever an issue is encountered with RBFS and needs to be reported to customer support.
The utility program collects data and converts this into a JSON file format. Each collected file is named after the respective table name or data it contains and is stored in a directory named with the corresponding timestamp. This directory is compressed into a zip file and saved in the following directories:
-
manual: /var/crash/debug_info/manual
-
cron: /var/crash/debug_info/cron_job
You can then attach and send this zipped file to the RtBrick support team. This information is valuable for troubleshooting many types of network issues, as it allows the support team to analyze the router’s state and configurations without directly accessing the router.
When users, who do not have the necessary permissions, attempt to access data from a table by executing the command, they will not be able to view the retrieved data.
How to Retrieve Data Using the Utility Program
To retrieve data, you can run the collect debug-information command in any of the modes: 'config', 'debug', 'operation'.
The following is the command syntax:
collect debug-information <option>
| Attribute | Description |
|---|---|
|
This option retrieves data from all daemons. |
|
Collects the information only from VPP and BCM (150 seconds). Running the command temporarily disrupts the system; afterward, the system returns to normal operation. |
|
Starts cron job. |
|
This option allows you to specify the daemon/module name so that the utility retrieves data only for that specific module/daemon. |
To collect debug information for all modules, use the following command:
collect debug-information all
| After executing the command, the data collection process takes a few seconds or minutes to complete. |
TACACS users can collect the debug information by specifying the following option in the TACACS Server configuration.
linux-group="debug_info,rtbrick_confd_sock_access.
For more details see, TACACS Server configuration in the "Securing Control Plane Management Guide".
For local user it is mandatory to configure debug information collection using the following command:
set system user <username> role debug_info
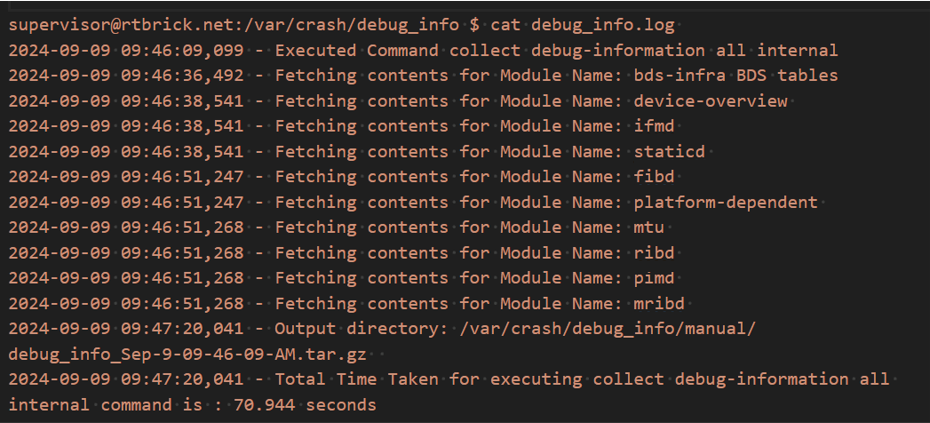
The following example command execution shows the date and time in sequential order as each daemon’s data is fetched. It also shows the total time taken to complete the collection process at the end
Periodic Data Collection
This utility program can also help in collecting system states and other information at scheduled intervals. This periodically collected information helps in understanding the system state before an issue occurs, which is useful in many scenarios.
The utility can be configured to automatically run at predefined intervals to collect data. After each run, it saves reports that can be used for further analysis and troubleshooting. You can define the intervals for periodic data collection to suit your needs.
The system employs Cron Job functionality to collect this periodic debugging information. A Cron Job is a scheduled task that runs automatically at specified intervals.
You can configure the Cron Job functionality to enable periodic data collection.
Setting Up Cron Job
You can specify the data collection interval, limit the number of files, and initiate the Cron job function.
Specify the Interval:
Define how frequently the system should collect debug information. The interval is specified in hours. The default interval for running the utility is 12 hours. Use the command:
set debug-information collector interval <interval>
| Attribute | Description |
|---|---|
|
Specifies the interval (in hours) for running the Debug Information (DUI) cron job. Range: 2 – 168 hours. |
Specify the File Limit:
Specify the maximum number of files to be stored for such runs. Once the limit is reached, the system will start overwriting the oldest files and this process continues. The default maximum number of files is 10. Use the command:
set debug-information collector max-files <max_files>
| Attribute | Description |
|---|---|
|
Specifies the maximum number of Debug Information (DUI) files that the cron job can retain. Range: 1 – 50. |
Stopping the Cron Job Function
You can use the following delete form of the command to halt the ongoing Cron Job process.
delete debug-information collector