Logging Overview
RBFS logging is the process of writing log messages during the execution of events. RBFS logging provides reports on events across the entire RBFS ecosystem, spanning different functional areas. In a hardware switch, this happens at 2 levels:
-
Inside the RBFS container
-
In the RtBrick Host
All these logs, generated by different components, can be exported to the log management server, where you can view and analyze real-time data.
RBFS provides logging for the entire RBFS ecosystem, including Brick Daemons (BD), as well as other (non-BD) daemons. Brick Daemons are built on top of Brick Data Store (BDS), and other (non-BD) daemons (such as Prometheus) are the ones that are not dependent on BDS. BDS provides an in-built infrastructure for logging, which can be used by all BDS applications.
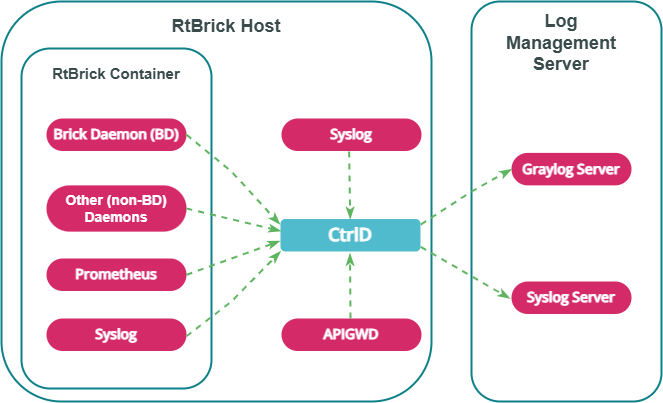
The diagram below shows how logs generated within the RBFS container (from Brick Daemon, Prometheus, and Syslog) and from API Gateway Daemon (APIGWD) are sent to Controller Daemon (CTRLD) on the RtBrick host. CTRLD aggregates these logs and exports them to an external Log Management Server for centralized monitoring and analysis.
Logging in RBFS Container
The RBFS container logging infrastructure (BDS Logging) provides low-latency, in-memory logging for large-scale systems without significant performance impact.
BDS Logging
Log Tables
BDS logs are stored in a BDS table. BDS creates a log table for each module in a BD. One entry is added to this log table for every log. Older entries are removed from the table when the number of entries exceeds 10,000. A log table is created for a module only if that module has at least one logged event. Every module in RBFS has at least one log table named in this format: <modulename>.<bd-name>.log.
Log Maps
Each log is mapped to a single event logged by the application. To optimize memory usage, RBFS does not store verbose strings; instead, it stores the log map as an identifier to the actual string message.
| The log map and the log ID refer to the same entity. |
Log Modules
Every BDS application consists of multiple modules. Logging can be configured for each BDS module separately.
The log modules supported by RBFS are: access_service, bcm_q2c, bd, bds, bds_mock, bgp, fib, fwdinfra, hostconfd, ifm, igmp, ipoe, isis, l2tp, lag, ldp, license, lldp, lwip_contrib, mrib, nat, oam, ospf, pim, policy, pool, poold, pppoe, pubsub, resmon, rib, rtbrick-cli, secure_management, snapshot, static, subsMgmt, time_series, validation, vpp.
Log Groups
A log group is a collection of log maps or log IDs. Groups have been introduced to simplify the log configuration tasks. For example, to debug a BGP peer issue, instead of enabling the entire bgp module logs, you can enable logging for the BGP peer log group.
Guidelines and Limitations for BDS Logging
The following are some guidelines and limitations for BDS logging:
-
By default, BDS logging is enabled, and the log level is set to 'Error'.
-
By default, logging for the BDS and PUBSUB modules has been disabled.
-
The user can configure log levels per BD or per module.
-
In a scaled setup, logging should not be kept enabled for an extended period.
-
When you set the log-level to "None", the log is disabled for the specific module, group, or globally.
Non-BDS Logging
Syslog
Syslog is generated by the Linux API-based logging mechanism. RBFS Linux container uses syslog for logging. Syslog can also be exported to Graylog. Currently, RBFS supports exporting syslog messages from the Linux system facilities, such as auth, authpriv, daemon, and kern, to Graylog.
TSDB (Prometheus) Alert Messages
Prometheus is the system and service monitoring application that can be deployed in RBFS to collect and process metrics. In RBFS, Prometheus-generated alert messages are forwarded to CtrlD, and from there they can be exported to the configured log management servers.
Logging in to the RtBrick Host
In RBFS, there are daemons that are not part of the RBFS container but run on the RtBrick host. RBFS provides logging for these daemons.
Plugin Alias
Any logs in RBFS can be exported to an external logging destination. Currently, CtrlD supports GELF and syslog as external plugins.
CtrlD is the egress node for all the GELF (Graylog Extended Log Format) messages. The brick daemons are configured to send GELF messages to CtrlD, which forwards them to the configured endpoints, such as syslog or a GELF endpoint. This is because CtrlD enhances the GELF message with switch-global settings (such as the switch’s serial number).
Supported Logging Formats
RBFS supports two types of logging formats: GELF and Syslog.
- GELF
-
GELF is a logging format for Graylog. It uses JSON to structure log messages, making them searchable and more structured. The supported protocol for GELF is HTTP.
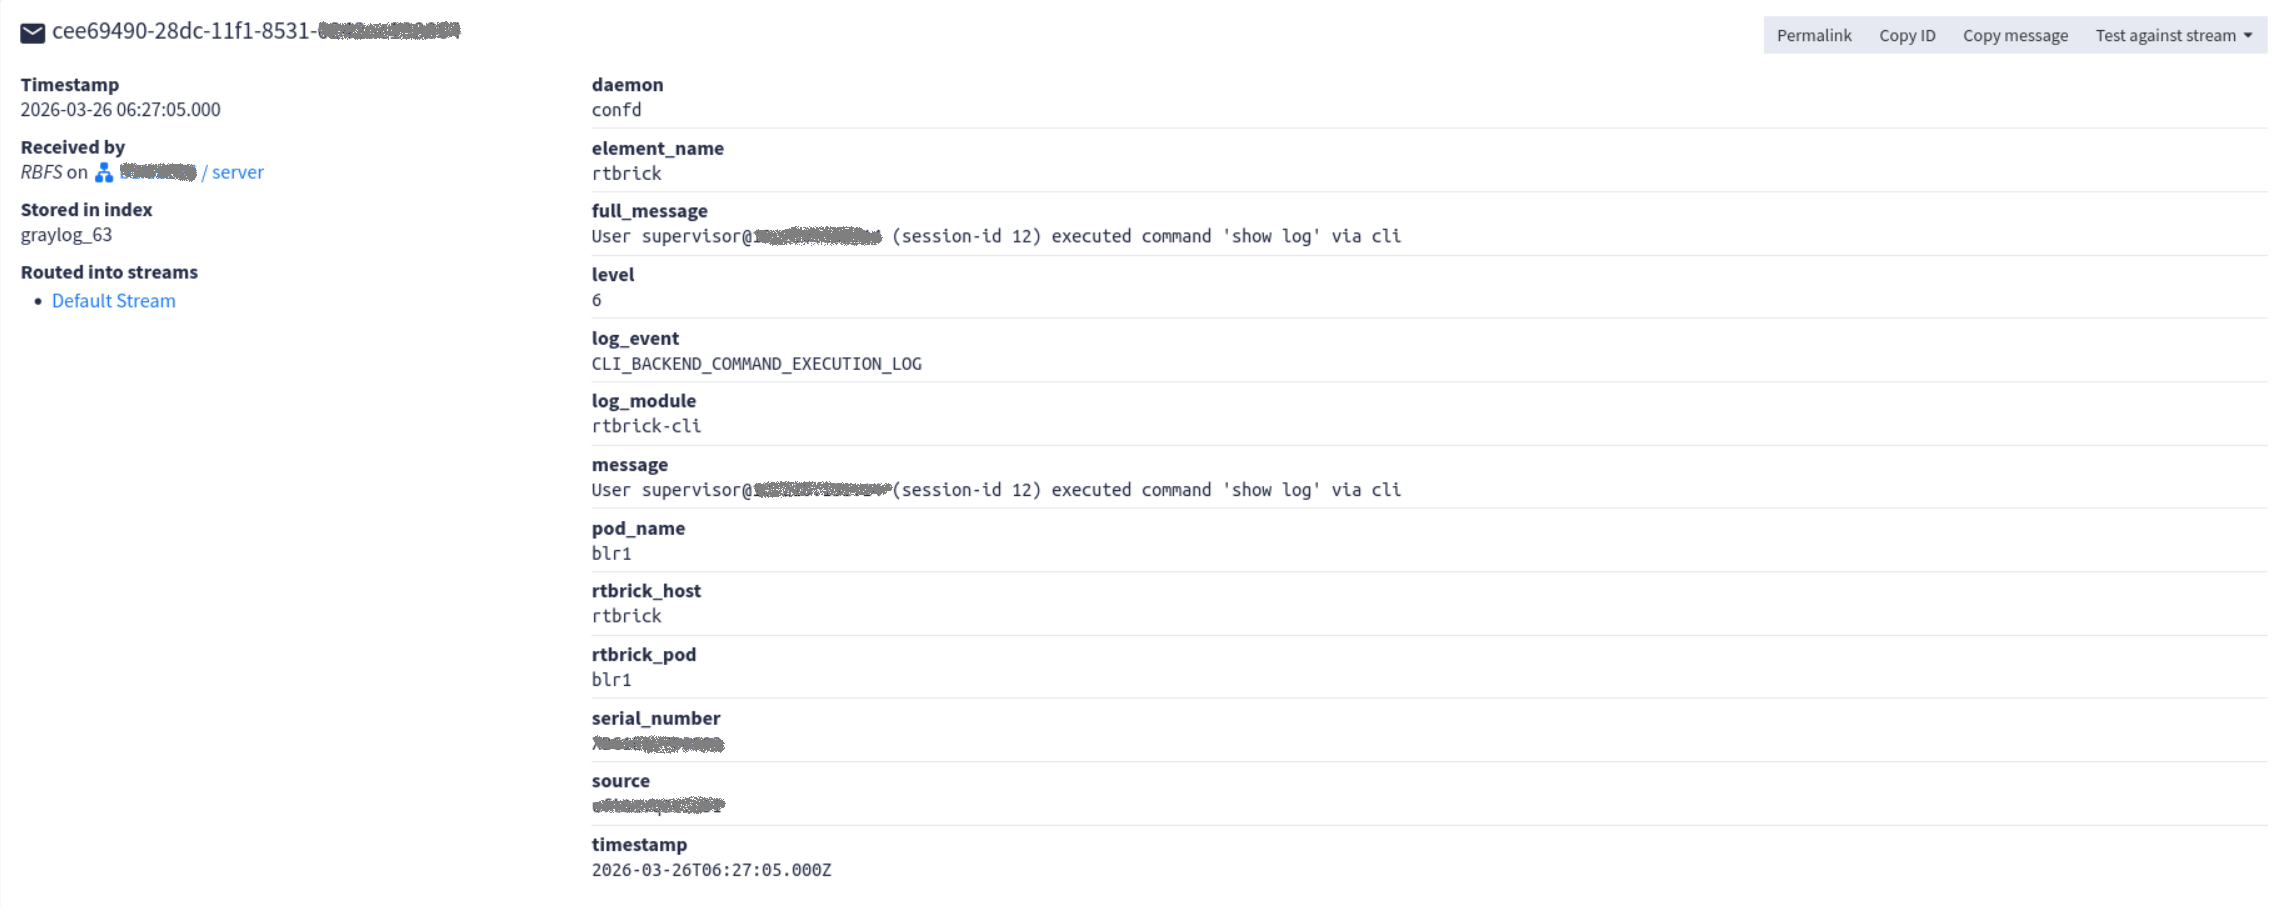
The diagram below shows the example of a GELF message on the Graylog Web Interface.
- Syslog
-
Syslog is a format used by Linux systems and many networking devices for logging. It is a plain text protocol with a defined structure. The supported Syslog transport protocols are TCP and UDP.
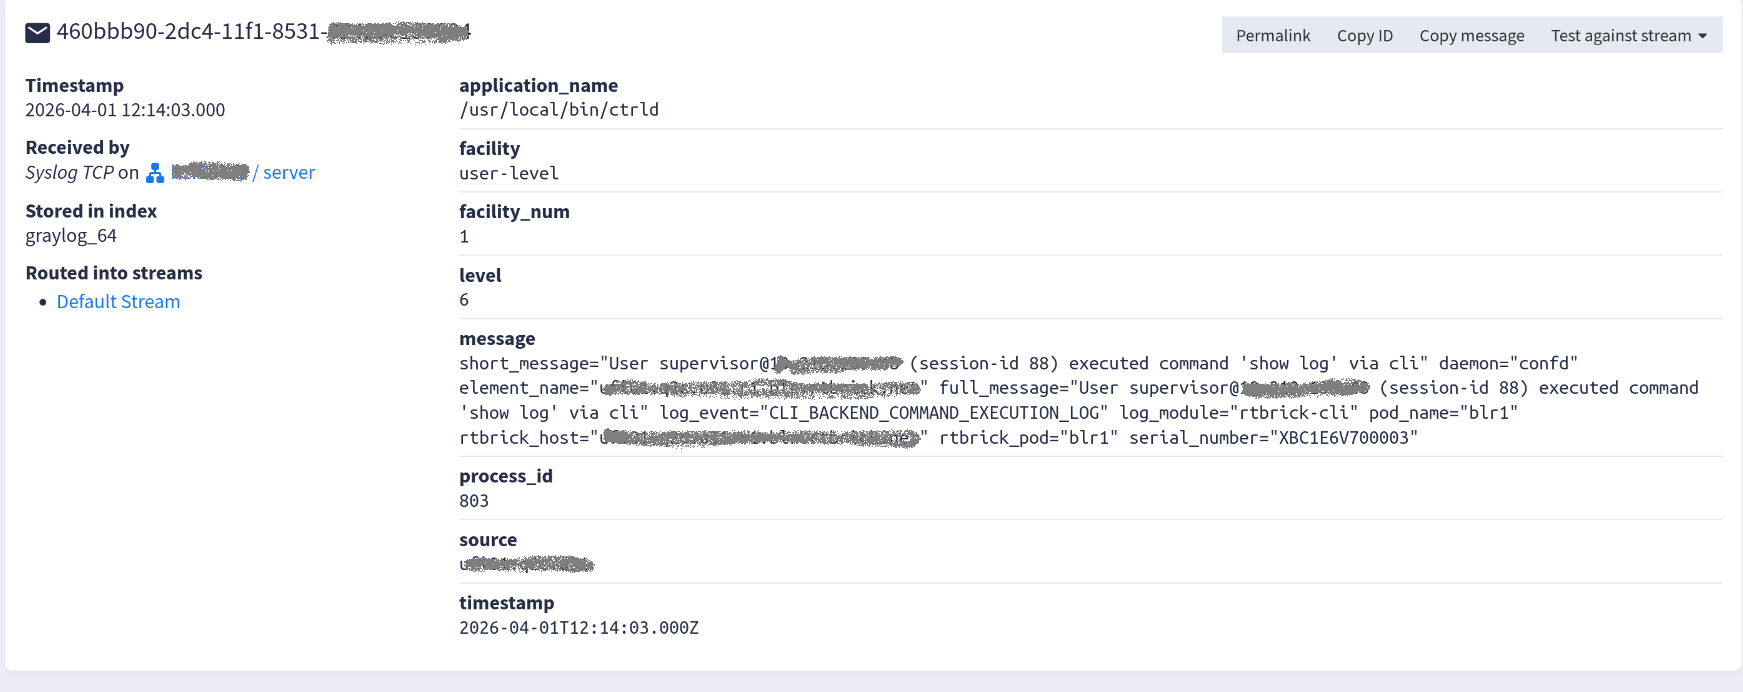
The diagram below shows the example of a message in syslog format as displayed on the Graylog Web Interface.
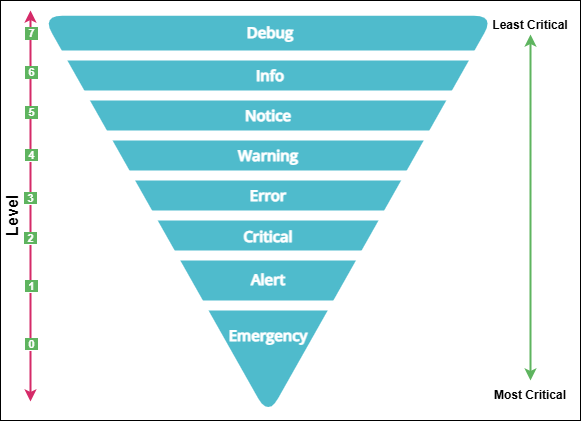
Log Levels
Log level indicates the severity of events (logs). You can configure logging by severity level. The diagram below shows the log levels supported by RBFS in order of priority:
| Level | Level Name | Description |
|---|---|---|
0 |
Emergency |
Events that cause the application to terminate. |
1 |
Alert |
A condition that should be corrected immediately. For example, “ISIS_AUTHENTICATION_FAIL” indicates an IS-IS authentication failure. |
2 |
Critical |
Severe error that will prevent the application from continuing. For example, “LICENSE_EXPIRY_CRITICAL” indicates that the current license has expired. |
3 |
Error |
Events that cause issues. For example, “LICENSE_EXPIRY_ERROR” indicates that the current license is about to expire. |
4 |
Warning |
Events that might cause issues. For example, “LICENSE_EXPIRY_WARNING” indicates that the current license is about to expire. |
5 |
Notice |
Conditions that are not error conditions, but that may require special handling. For example, “PPPOE_SESSION_LIMIT_REACHED” indicates that the PPPoE session limit has been reached. |
6 |
Info |
Events showing normal application behaviour. For example, “PPPOE_SESSION_DELETE” indicates that the PPPoE session deletion has occurred. |
7 |
Debug |
Diagnostic information used for debugging. For example, “PPPOE_LCP_START_ECHO” indicates that the PPP LCP echo request interval has started. |
|