Configuring Time Series Database
The following section describes how to configure the system to gather metrics and alerts out of the system.
Metric
To better understand the Data Model have a look at the Prometheus Data Model.
Metric Data Model
In RBFS it is possible to turn each table attribute into a metric.
| When you export the time-series metric data for an attribute which has more than 50 label values (user-defined, default labels), you may see truncated data in the exported metric. |
The following table describes the configuration model:
Metric |
|
metric_name |
Name of the metric (metric name conventions). That is the unique identifier for the metric. |
table_name |
Table Name for which the metric is designed, could also be a regular expression. |
append_timestamp |
Timestamp is epoch rendered in milliseconds and its value is equal to current metrics value’s creation time in RBFS. |
bds_metric_type |
|
index_name |
Name of the index, if the bds_metric_type is index-metric. |
metric_type |
|
metric_description |
Description of the metric. |
attributes |
List of Attributes (see Attribute Table) that will be streamed as metric. |
filters |
List of AttributeFilters (see AttributeFilter Table) that filters the table rows which should be considered for metric generation. Each filter in this list has to match in order to generate the metric, so the list implies an implicit AND. |
Attribute |
|
attribute_name |
Name of the attribute that should be streamed as metric. This Attribute has to be a numeric type, or a type that has a numeric converter. |
filters |
List of AttributeFilters (see the [AttributeFilter] table) that filters the table rows which should be considered for metric generation. Each filter in this list has to match in order to generate the metric, so the list implies an implicit AND. |
labels |
List of AttributeLabels (see the [AttributeLabel] table) that are attached to that metric. |
AttributeFilter |
|
match_attribute_name |
Attribute of the Table which is used to match against. |
match_type |
|
match_value |
The value that attribute has to match against. |
AttributeLabel CAUTION: Remember that every unique combination of key-value label pairs represents a new time series, which can dramatically increase the amount of data stored. Do not use labels to store dimensions with high cardinality (many different label values), such as user IDs, email addresses, or other unbounded sets of values. |
|
label_name |
Name of the Label (label name conventions). |
dynamic |
bool: If the label is dynamic, the label_value is treated as attribute_name, so the value of the attribute is used as the label value, otherwise the label value is used directly. |
label_value |
The value of the label or the attribute which should be used as label value. |
filters |
List of AttributeFilters (see [AttributeFilter] Table) that filters the table rows which should be considered for label generation. Each filter in this list has to match in order to generate the label, so the list implies an implicit AND. |
Configuring Metrics
The configuration of the Metrics can be done in various ways.
Configuring Metrics using Command Line Interface
To configure the Time Series Database, perform the following steps:
-
Define Metric configuration
-
Define Attribute configuration
-
Optional Filters at Metric Level and Attribute level
-
Defining labels to be attached to exported metric
Metric Configuration
Metric configuration is used to configure the parameters of the metric data being exported.
| Depending on the platform the exact resource name to be monitored can be found in global.chassis_0.resource.sensor, and adjust the Prometheus/Grafana configuration accordingly. |
Syntax
Command arguments
<metric-name> |
Specifies the name of the metric exported, as would be reflected in Prometheus. Use the naming conventions as recommended by Prometheus |
<128 character description about the metric-name > |
Description of the metric |
<counter / gauge> |
Configures the metric data type. Currently the supported Prometheus metric data are: counter and gauge |
<object-metric / index-metric > |
Specifies the type of attribute, that is scraped and exported. There are two types, object-metric and index-metric |
<table-name> |
Specifies the target table, from which the data is scraped and exported. |
<attribute-name> |
Specifies the name of the attribute, in the target table to be scraped and exported |
<append-timestamp> |
Set the append-timestamp to true for exporting the metric values with timestamp. By default, the value is 'false'. |
<index-name> |
Specifies the index-name of the index-metric attribute. This configuration is applicable for index-metric alone. |
<match-attribute-name> |
Specifies the matching attribute name for the filter |
include-subscribed-tables [true / false] |
Specifies whether the configuration needs to be applied on a subscribed tables as well. Default: false. |
Example
admin@rtbrick: cfg> set time-series metric chassis_fan_speed_rpm
admin@rtbrick: cfg> set time-series metric chassis_fan_speed_rpm table-name global.chassis_0.resource.sensor
admin@rtbrick: cfg> set time-series metric chassis_fan_speed_rpm bds-type object-metric
admin@rtbrick: cfg> set time-series metric chassis_fan_speed_rpm prometheus-type gauge
admin@rtbrick: cfg> set time-series metric chassis_fan_speed_rpm description "Chassis fan speed in rpm"
admin@rtbrick: cfg> set time-series metric chassis_fan_speed_rpm attribute rpm
admin@rtbrick: cfg> set time-series metric chassis_fan_speed_rpm include-subscribed-table false
Allowed Attribute Types (Type Converters)
Normally only attributes are allowed, which are of type numeric, but for some types, there are built-in type converters, which allow also to use attributes of their types.
For the following BDS types, built-in type converters are provided by BDS. As per Prometheus data model, type converter will convert the BDS type into a 64bit float number.
BDS data type |
Outcome number represents |
unix-wallclock-timestamp |
Seconds |
unix-usec-wallclock-timestamp |
Seconds |
unix-usec-monotonic-timestamp |
Seconds |
unix-usec-coarse-wallclock-timestamp |
Seconds |
bandwidth |
bps(bit per second) |
temperature |
Degree Celsius |
Metric Filter Configuration
Metric filter configuration is used to configure the parameters of the filter. It is used to filter the exported metric. This is an optional configuration.
Syntax
Command arguments
<match-attribute-name> |
Specifies the filter that filters the exported metric, based on specified criteria. This is optional configuration. |
< exact / regular-expression > |
Specifies the match type to be used, There are two options, exact and regular-expression. |
<match-attribute-value> |
Specifies the attribute value used for match. Fixed value for exact. Regex pattern for regular-expression |
Example
Exact Value
admin@rtbrick: cfg> set time-series metric chassis_fan_speed_rpm filter resource_type match-attribute-value fan
admin@rtbrick: cfg> set time-series metric chassis_fan_speed_rpm filter resource_type match-type exact
Regular Expression
admin@rtbrick: cfg> set time-series metric chassis_fan_speed_rpm filter resource_name match-attribute-value Chassis.*
admin@rtbrick: cfg> set time-series metric chassis_fan_speed_rpm filter resource_name match-type regular-expression
Metric Attribute Label Configuration
Metric attribute config is used to configure the labels to be attached to the exported metric.
Syntax
Command arguments
<label-name> |
Specifies the name of label. User definable, Please use naming conventions as recommended by Prometheus |
<dynamic / static> |
Specifies the type of labels, a static value or dynamic value to be added. |
<label-value> |
Specifies the label-value to be used. |
Example
Dynamic Label
admin@rtbrick: cfg> set time-series metric chassis_fan_speed_rpm attribute rpm label fan
admin@rtbrick: cfg> set time-series metric chassis_fan_speed_rpm attribute rpm label fan label-value resource_name
admin@rtbrick: cfg> set time-series metric chassis_fan_speed_rpm attribute rpm label fan label-type dynamic
Static Label
admin@rtbrick: cfg> set time-series metric chassis_fan_speed_rpm attribute rpm label vender
admin@rtbrick: cfg> set time-series metric chassis_fan_speed_rpm attribute rpm label fan label-value rtbrick
admin@rtbrick: cfg> set time-series metric chassis_fan_speed_rpm attribute rpm label fan label-type static
Metric Attribute Filter Configuration
Attribute filter config is used to configure the parameters of Attribute filter. It is used to filter the exported metric based on certain fields of the attribute. This is an optional configuration.
Syntax
Command arguments
<attribute name> |
Specifies the filter that filters the exported metric , based on criteria of the attribute. This is optional config. |
<exact / regular-expression> |
Specifies the match type to be used, There are two options, exact and regular-expression. |
<match-attribute-value> |
Specifies the attribute value used for match. Fixed value for exact. Regex pattern for regular-expression |
Example
The below example shows, the metric attribute will be exported only if the port_stat_if_in_discards is exactly 0.
admin@rtbrick: cfg> set time-series metric interface_statistics_data attribute port_stat_if_in_ucast_pkts filter port_stat_if_in_discards
admin@rtbrick: cfg> set time-series metric interface_statistics_data attribute port_stat_if_in_ucast_pkts filter port_stat_if_in_discards match-type exact
admin@rtbrick: cfg> set time-series metric interface_statistics_data attribute port_stat_if_in_ucast_pkts filter port_stat_if_in_discards match-attribute-value 0
Metric Label Filter Configuration
Label filter configuration is used to set filter parameters that can be used to attach label based on certain criteria. This is an optional configuration.
Syntax
Command arguments
<match-attribute-name> |
Specifies the filter that filters the exported metric, based on some attribute value.This is optional config. |
< exact / regular-expression > |
Specifies the match type to be used, There are two options, exact and regular-expression. |
<match-attribute-value> |
Specifies the attribute value used for match. Fixed value for exact. Regex pattern for regular-expression |
Example
The below example sets label, interface_orientation to the exported data, only if the interface_name matches ifp-0/0/50.
admin@rtbrick: cfg> set time-series metric interface_statistics_data attribute port_stat_if_in_ucast_pkts label interface_orientation
admin@rtbrick: cfg> set time-series metric interface_statistics_data attribute port_stat_if_in_ucast_pkts label interface_orientation filter interface_name
admin@rtbrick: cfg> set time-series metric interface_statistics_data attribute port_stat_if_in_ucast_pkts label interface_orientation filter interface_name match-type exact
admin@rtbrick: cfg> set time-series metric interface_statistics_data attribute port_stat_if_in_ucast_pkts label interface_orientation filter interface_name match-attribute-value  ifp-0/0/50
Alert
RBFS uses the prometheus alerting feature to generate alerts. These alerts are forwarded to an alertmanager instance inside the rbfs container. The alertmanager instance sends the alert to CTRLD which distributes the alert to an HTTP Endpoint.
Alerts are also configured in a BDS table, and they are exported to Prometheus by the system.
Alert Data Model
Alert |
|
name |
The name of the alert rule. |
group |
Name of the alert group the alert belongs to. |
interval |
How often the rule should be evaluated. Pattern:"[0-9]+(ms |[smhdwy]" Example:"5s" In Prometheus the the interval can specified per alert group. So the alert alert group for Prometheus is calculated via {alert_group}_{interval}. |
expr |
Alert evaluation expression in promql |
labels |
Key, Value pairs of labels that should be applied. The labels clause allows specifying a set of additional labels to be attached to the alert. Any existing conflicting labels will be overwritten. The label values can be templated (see templating). |
annotations |
Key, Value pairs of annotations that should be applied. The annotations clause specifies a set of informational labels that can be used to store longer additional information such as alert descriptions or runbook links. The annotation values can be templated (see templating) |
for |
Alerts are considered firing once they have been returned for this long. Alerts which have not yet fired for long enough are considered pending. Pattern:"[0-9]+(ms |[smhdwy]" Example:"30s" |
level |
This is an explicit annotation label with the label name level.
This is used to specify the severity: |
summary |
This is an explicit annotation label with the label name summary. The annotation values can be templated (see templating). |
description |
This is an explicit annotation label with the label name description. The annotation values can be templated (see templating). |
Configuration
The configuration of the Metrics can be done in various ways.
Configuring Alert Using CLI
Syntax
Command arguments
| <name> | The name of the alert rule. That is the unique identifier for the rule. |
|---|---|
<group> |
Name of the alert group the alert belongs to. The alert group helps to structure the alerts. |
<interval> |
How often the rule should be evaluated. Pattern:"[0-9]+(ms |[smhdwy]" Example:"5s" In Prometheus the the interval can specified per alert group. So the alert alert group for Prometheus is calculated via {alert_group}_{interval}. |
<expr> |
Alert evaluation expression in promql |
<label> |
Key, Value pairs of labels that should be applied. The labels clause allows specifying a set of additional labels to be attached to the alert. Any existing conflicting labels will be overwritten. The label values can be templated (see templating). |
<annotations> |
Key, Value pairs of annotations that should be applied. The annotations clause specifies a set of informational labels that can be used to store longer additional information such as alert descriptions or runbook links. The annotation values can be templated (see templating) |
<for> |
Alerts are considered firing once they have been returned for this long. Alerts which have not yet fired for long enough are considered pending. Pattern:"[0-9]+(ms |[smhdwy]" Example:"30s" |
<level> |
This is an explicit annotation label with the label name level. This is used to specify the severity: 1.Alert The annotation value can be templated (see templating) |
<summary> |
This is an explicit annotation label with the label name summary. The annotation values can be templated (see templating). |
<description> |
This is an explicit annotation label with the label name description. The annotation values can be templated (see templating). |
Example
admin@rtbrick: cfg> set time-series alert sample_alert
admin@rtbrick: cfg> set time-series alert sample_alert group hardware_metrics
admin@rtbrick: cfg> set time-series alert sample_alert for 30s
admin@rtbrick: cfg> set time-series alert sample_alert interval 5s
admin@rtbrick: cfg> set time-series alert sample_alert expr avg_over_time(cpu_temperature_celcius[1m])>100
admin@rtbrick: cfg> set time-series alert sample_alert level 2
admin@rtbrick: cfg> set time-series alert sample_alert summary "Element {{ $labels.element_name }} CPU {{$labels.cpu}} HIGH temperature"
admin@rtbrick: cfg> set time-series alert sample_alert description "Cpu {{ $labels.cpu }} of element {{ $labels.element_name }} has a temperature o
ver 100 for more than 30 seconds"
admin@rtbrick: cfg> set time-series alert sample_alert labels device:leaf1
admin@rtbrick: cfg> set time-series alert sample_alert annotations "sample-annotation-key:sample-value"
Enabling/Disabling Time Series Database History
In every Brick Daemon, the history of time series databases can be enabled. By default, time series database history is disabled.
Syntax
set time-series history-status <option>
| Attribute | Description |
|---|---|
[disable|enable] |
Enable or disable time series database history. Time series database history is disabled, by default. |
Example:
supervisor@S2-STD-7-7006>bm06-tst.fsn.rtbrick.net: cfg> show datastore confd table global.time-series.config
Object: 0, Sequence 3, Last update: Mon May 23 09:02:28 GMT +0000 2022
  Attribute                                Type                           Length     Value
  configuration_name (1)                   string (9)                          8     rtbrick
  time-series-history-enable (2)           boolean (6)                         1     False
Graylog Alert Distribution
The alertmanager on RBFS is configured to send alerts to CTRLD.
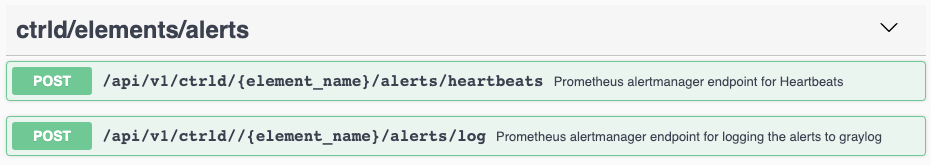
CTRLD therefore has an endpoint where the alerts are sent to. CTRLD translates the notification and forwards the message to the configured log management system. The instance used for forwarding is "prometheus".