Metric sampling Overview
Metric sampling is configured through the CTRLD/RESTCONFD API. The sampled data is stored in Prometheus, an open source monitoring tool with a built-in time series database (TSDB), and can be queried from the switch using PromQL, the Prometheus Query Language. The CTRLD API also supports programming alert conditions in Prometheus Alert Manager.
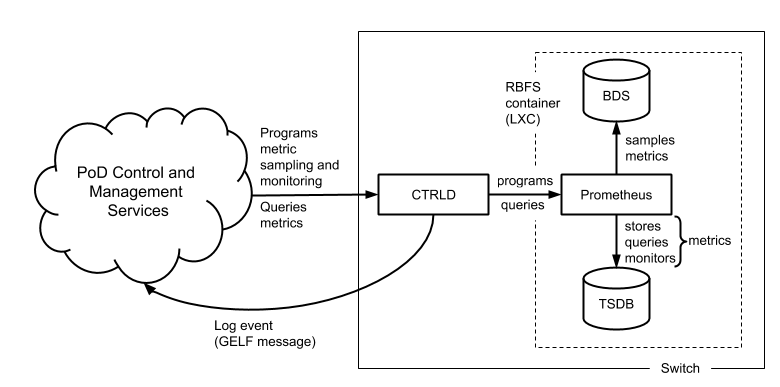
Brick daemons feeding data into BDS are not depicted to keep the drawing simple.
BDS as Single Point of Truth
The Brick Data Store (BDS) is an object-oriented in-memory database that stores the switch configuration and operational state. BDS objects are typed objects, which means that every object and object attribute is of a certain type. BDS objects are described in schemas and organized in tables. One or more indexes per table exists to query objects. BDS supports sampling values from
-
BDS object attributes and from
-
BDS table indexes.
Every numeric BDS object attribute can be periodically sampled to create a time series of the attribute value. In addition, BDS provides built-in converters for some attribute types that can be converted to numeric values. The bandwidth type is a good example. The bandwidth is stored as a string and consists of a numeric value and a data rate unit, for example, 100.000 Gbps. The built-in converter translates the bandwidth to a numeric value in bits per seconds.
BDS indexes are sampled if the number of objects in a table is of interest. This tutorial includes examples for object- and index-based metrics.
Metric Types
There exist two types of metrics:
-
gauge
-
counters
A gauge metric values are within a certain range and can basically be visualized as is or after applying a simple linear transformation. The value of a gauge metric can increase and decrease. A temperature value is an example for a metric of type gauge.
Counters increase until they are reset manually or by a restart (or by an overflow which is very unlikely to happen because of the length of the data word to store the counter value). The interesting aspect when working with counters is the delta of the count value between two samples, i.e. the derivation of the counter value over time. The derivation of the counter value is still an absolute value that needs to be put into perspective to the available resources to compute the resource utilization in percent. The CPU tick counters are examples for counter metrics.
Metric Labels
Metric labels separate metric instances from each other. Metric labels have either a static value or is read from a BDS object attribute.
The byte counters, for example, exist for each physical interface. The ifp_name label assigns the sampled counter values to the physical interface and is read from the interface_name attribute.
Sampling Rate and Retention Period
The sampling rate is 5 seconds and the retention period is five days. The configuration is built-in to the image and cannot be changed through the CTRLD API.
Metric Monitoring
Metric monitoring relies on the Prometheus Alert Manager. The alert manager notifies CTRLD about all satisfied alert conditions. CTRLD translates the notification and forwards the message to the configured log management system. CTRLD exposes an API for programming alert conditions and in turn programs the Prometheus Alert Manager based on the specified alert rules.