Temperature Monitoring
The first example in this tutorial samples and monitors temperature values to outline how to work with gauge metrics. Open the RBFS CLI and run show sensor temperature` to list all available temperature sensors.
supervisor@rtbrick>BNG: op> show sensor temperature
Name                     Temperature          Status
CPU Core                     49°C             PRESENT
LM75-1-48                    34°C             PRESENT
LM75-2-49                    33°C             PRESENT
LM75-3-4A                    29°C             PRESENT
LM75-3-4B                    31°C             PRESENT
PSU-1 Thermal Sensor 1       28°C             PRESENT
This switch has four chassis temperature sensors (LM75), a CPU temperature sensor (CPU Core) and a power supply unit (PSU) temperature sensor (PSU-1 Thermal Sensor 1). A switch typically has two independent power supply units. The second PSU of this switch was not attached in the lab environment.
The temperature is read from the temperature attribute of the sensor_object stored in the global.chassis_0.resource.sensor BDS table. The sensor object also includes a type (resource_type attribute) and a name (resource_name attribute). The unit of the temperature is millidegree celsius. An excerpt of the sensor schema definition is listed below:
      {
        "codepoint": 2,
        "name": "resource_name",
        "type": "string",
        "description": "Name of the resource"
      },
...
      {
        "codepoint": 4,
        "name": "resource_type",
        "type": "string",
        "description": "resource type"
      },
	...
      {
        "codepoint": 33,
        "name": "temperature",
        "type": "uint32",
        "description": "temperature in millidegree celsius"
      }
| Contact RtBrick professional services if you need help in finding the BDS table and attribute names. |
Sampling Temperature Sensors
Based on the available sensors it makes sense to create three temperature metrics:
-
chassis_temperature_millicelsius to sample the chassis temperature
-
cpu_temperature_millicelsius to sample the CPU temperature and
-
psu_temperature_millicelsius to sample the PSU temperature.
The CTRLD/RESTCONFD API exposes the `/api/v1/rbfs/elements/{{element}}/services/restconfd/proxy/restconf/data/rtbrick-config:time-series/metric={metric_name} endpoint. A HTTP PUT request to this endpoint configures a metric by either creating a new metric or replacing an existing metric with the specified {metric_name}. {element} contains the name of the element assigned in the element configuration file and defaults to the container name if no element name was specified. The default container name is rtbrick.
All metrics need to be labeled with the sensor name. In addition, a filter is needed to sample only the sensors for the respective type of temperature. The listings below show the JSON objects to sample the chassis temperature as an example:
{
    "rtbrick-config:metric": [
        {
            "name": "chassis_temperature_millicelsius",
            "table-name": "global.chassis_0.resource.sensor",
            "bds-type": "object-metric",
            "prometheus-type": "gauge",
            "description": "Chassis temperature in millidegree celsius",
            "filter": [
                {
                    "match-attribute-name": "resource_name",
                    "match-attribute-value": "LM.*",
                    "match-type": "regular-expression"
                },
                {
                    "match-attribute-name": "resource_type",
                    "match-attribute-value": "thermal",
                    "match-type": "exact"
                }
            ],
            "attribute": [
                {
                    "attribute-name": "temperature",
                    "label": [
                        {
                            "label-key": "sensor",
                            "label-value": "resource_name",
                            "label-type": "dynamic"
                        }
                    ]
                }
            ]
        }
    ]
}
The temperature metric is of type gauge (metric_type) and sample from a BDS object (bds_metric_type). The temperature value shall be sampled, which is of numeric type (uint32, see the schema definition above). The filter section makes sure that only thermal sensors are sampled and also filters for the LM sensors that measure the chassis temperature.
Querying the Chassis Temperature
The following PromQL query returns the chassis temperature in degree Celsius from the Prometheus running on the switch.
chassis_temperature_millicelsius / 1000
The next query converts the chassis_temperature from degree Celsius to Fahrenheit:
(chassis_stemperature_millicelsius / 1000) * 9 / 5 + 32
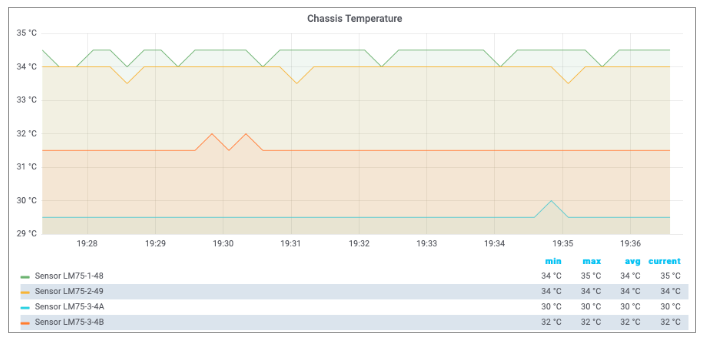
Both expressions are examples for simple linear transformations of a gauge metric. The queries can be used in Grafana to visualize the chassis temperature time series. The screenshot below shows a chassis temperature panel of a Grafana dashboard:
| The Grafana dashboard settings for the metrics used in this tutorial can be requested from RtBrick professional services. |
Monitoring Temperature Values
A high temperature can damage the device or shorten its lifetime. Therefore it makes sense to monitor the temperature to get notified about critical temperature values. The alert condition is defined by the acceptable duration of exceeding a specified temperature value, for example, the average chassis temperature is not allowed to exceed 40°C over the last five minutes.
| The temperature threshold and evaluation period are example values. The actual values must be taken from the hardware platform documentation or requested from the vendor. |
The listing below shows the complete chassis temperature alert rule.
{
    "rtbrick-config:alert": [
        {
            "name": "ChassisTemperatureAlert",
            "group": "health",
            "interval": "1m",
            "expr": "avg_over_time(chassis_temperature_millidegrees[1m]) / 1000 > 40",
            "for": "5m",
            "level": "1",
            "summary": "The chassis temperature exceeded 40°C.",
            "description": "The {{$labels.element_name}} average chassis temperature over the past 5 minutes exceeded 40°C."
        }
    ]
}
The alert rule evaluates every single minute (interval) whether the average temperature in the past minute exceeded 40 degrees (expr) and raises an alert if the expression is satisfied for 5 minutes (for), that is, 5 times in a row. The summary field contains a short description of the problem whereas the optional description field contains a more detailed message. The summary is mapped to the short_message GELF field and the description is mapped to the full_message GELF field. The severity is set to Alert (level). The level attribute values are taken from the GELF format which in turn took it from the Syslog protocol. The table below lists all supported levels:
Level |
Description as in RFC 5424 |
|
Name |
Comment |
|
0 |
Emergency |
System is unusable |
1 |
Alert |
Action must be taken immediately |
2 |
Critical |
Critical conditions |
3 |
Error |
Error conditions |
4 |
Warning |
Warning conditions |
5 |
Notice |
Normal but significant condition |
6 |
Informational |
Informational messages |
7 |
Debug |
Debug-level messages |
Every alert rule has a unique name (alert_rule_name). The PUT operation replaces an existing alert rule with the same name. Every alert rule is assigned to exactly one alert group (alert_group). All alert rules in the same alert group with the same interval setting are evaluated at the same time.
The for attribute is optional. A similar alert rule can be implemented by omitting the for attribute and computing the average temperature over the past five minutes:
{
    "rtbrick-config:alert": [
        {
            "name": "ChassisTemperatureAlert",
            "group": "health",
            "interval": "1m",
            "expr": "avg_over_time(chassis_temperature_millidegrees[5m]) / 1000 > 40",
            "level": "1",
            "summary": "The chassis temperature exceeded 40°C.",
            "description": "The {{$labels.element_name}} average chassis temperature over the past 5 minutes exceeded 40°C."
        }
    ]
}
There is a subtle difference between both rules. Consider the following temperature values:
The first rule does not fire because the threshold is only exceeded for three times, whereas the second rule fires because the average over the past five minutes exceeds 40°C. In fact, the second rule fires an alert albeit the temperature exceeds the alert threshold for 4 minutes only. How about using the min rather than the avg function, i.e. the temperature must exceed the threshold for five minutes? In this case, the rule wouldn’t fire an alert if the chassis temperature is wobbling around the threshold.
The first rule aims to mitigate both effects:
-
The first rule fires an alert if the chassis temperature is wobbling around the threshold but on average exceeds the threshold five times in a row.
-
The first rule does not fire an alert in case of a chassis temperature spike as depicted in Figure 3, because a spike does not satisfy the rule five times in a row.