Overview
RtBrick’s Management System (RBMS) provides network level workflows such as image lifecycle management, network upgrades, event and log Management. RBMS actions are available through REST APIs making them easy to integrate into existing Operations Support Systems (OSS) systems. RBMS provides a single point of interaction for operations staff – from provisioning and management to monitoring and debugging.
The RBMS user interface provides the following capabilities:
-
Image: Manage software images
-
Inventory: Manage network elements
-
Metrics: Manage the metrics sampled from network devices
-
Jobs: Review the currently active or scheduled jobs
-
Logs: View logs messages from the switches
-
Administration: Manage users, roles, and access tokens.
System Architecture
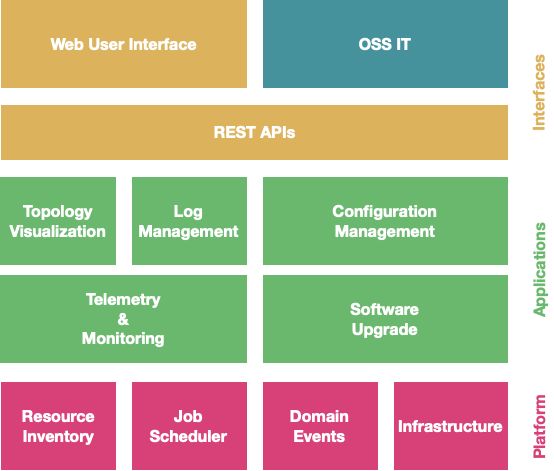
RBMS follows a service-oriented architecture and defines three categories of services:
-
Platform Services
-
Applications
-
Connectors

Platform Services provide the foundation for all network management functions available in RBMS. The platform services include the resource inventory, job scheduler, authentication and authorization and event subscription.
Applications provide a specific network management function. Applications use the platform services and also services provided by other applications to implement network management functions. For example, the topology application visualizes the link-state graph of a fabric.
Connectors interface RBMS with open-source solutions like log management systems or time series databases.
All services provide a REST API to interface with the service. The RBMS User Interface uses these REST APIs. Consequently, all UI actions can be automated through REST API calls. Services can contribute views to the RBMS UI to make the provided service functions accessible from the RBMS UI.
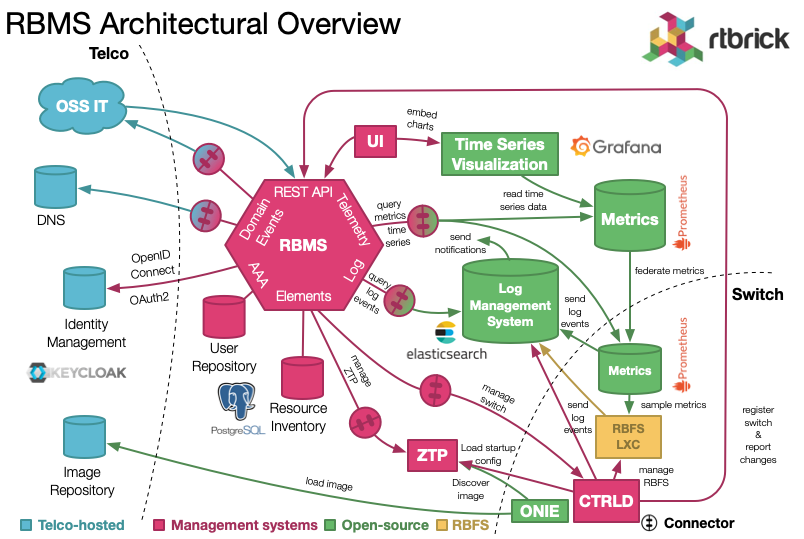
The figure below shows a real-world RBMS deployment.

OSS-IT and RBMS UI manage the switches installed in the network. This includes to inspect the state of a switch but also to manage the switch configurations or to install a new software image.
OSS-IT can also subscribe for domain events. A domain event reports when a switch inventory record has changed.
RBMS maintains the switch configurations and publishes the switch startup configuration on the ZTP service. This configuration also includes the software image to be installed on the switch.
ONIE, the open network install environment reads the installer image information from the ZTP service and installs RBFS. Next CTRLD reads the startup configuration from the ZTP service.
RBFS reports log messages to Graylog, an open-source enterprise log management. Graylog uses elasticsearch to store log messages. RBMS is connected to elasticsearch to query the logs and display them in RBMS.
Prometheus, an open-source monitoring system with built-in timeseries database, runs on the switch to sample metrics and to monitor metrics for alert conditions. A centralized Prometheus federates the metrics from the switches. RBMS is connected to this Prometheus instance to show the metric values in the RBMS user interfaces.
Grafana, an open-source visualization platform, provides dashboards to visualized the time series data. The RBMS UI provides quick-access to the dashboards and embedds dashboard panels in RBMS views.
Authentication and authorization is either delegated to an OpenID/Connect and OAuth2-compatible authorization service or done by the built-in user repository shipped with RBMS.