Metric Management
Overview
In order to understand metric processing in RBMS it is key to understand how metrics are sampled on RBFS.
RBFS runs Prometheus, an open-source monitoring tool with built-in time series database, to sample metrics from the Brick Data Store (BDS). The BDS is an in-memory database developed by RtBrick and optimized for networking use cases. All configuration and state information is stored in BDS. BDS can be configured to expose certain BDS attributes as metrics in the Prometheus Exposition Format. Prometheus periodically samples the exposed values to create a time series over them. The Prometheus Query Language allows querying the time series data and to apply transformations and statistical computations.
Prometheus includes an alert manager to scan time series for alert conditions and to create a notification whenever an alert condition is satisfied. Since Prometheus runs on the switch the alert conditions are also evaluated on the switch.
All metrics and alerts that shall be enabled permanently by default are configured in the running configuration of the switch. CTRLD allows enabling and disabling metrics on-demand.
The main goal of RBMS is to provide quick access to metrics and time series visualization. RBMS runs a Prometheus instance to federate metrics from the Prometheus instances on the switches. Grafana, an open-source visualization platform, is used to visualize time series data.
The figure below summarizes how RBMS interfaces with Grafana and Prometheus.
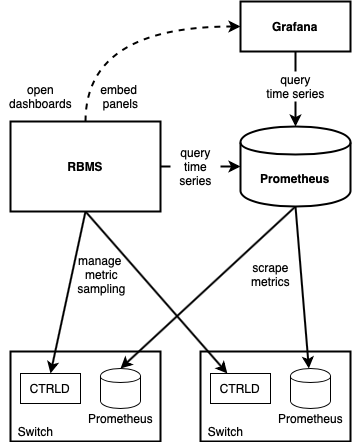
The RBMS UI provides quick access to Grafana dashboards and embedds dashboard panels in the RBMS UI. In addition, RBMS queries Prometheus based on the configured metrics and the inventory data to provide quick access to the current metric values.
| The Metrics Sampling and Monitoring Tutorial provides more details about the concepts outlined in this section. |
Working with metrics
Viewing metrics
To view the metrics of an element
-
Click the Inventory tab. The list of pods appears.
-
In the pods group box, click on the elements link for pod that contains the element you want to view the metrics for. The list of elements appears.
-
In the elements group box, click on the element you want to view the metrics for.
-
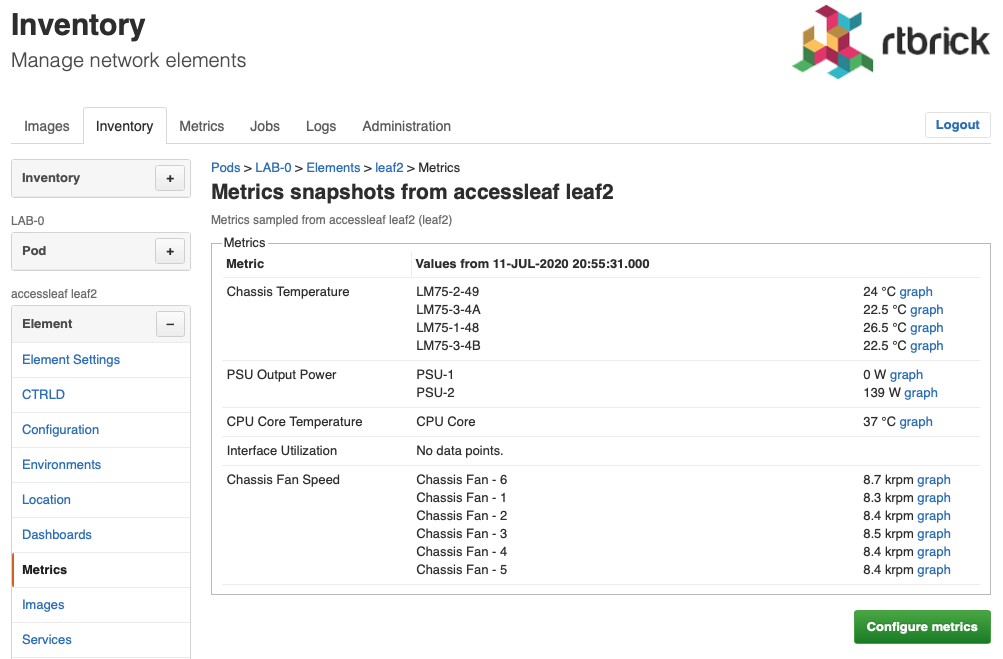
Click Metrics in the left navigation pane. The list of metrics and their current values appears.
-
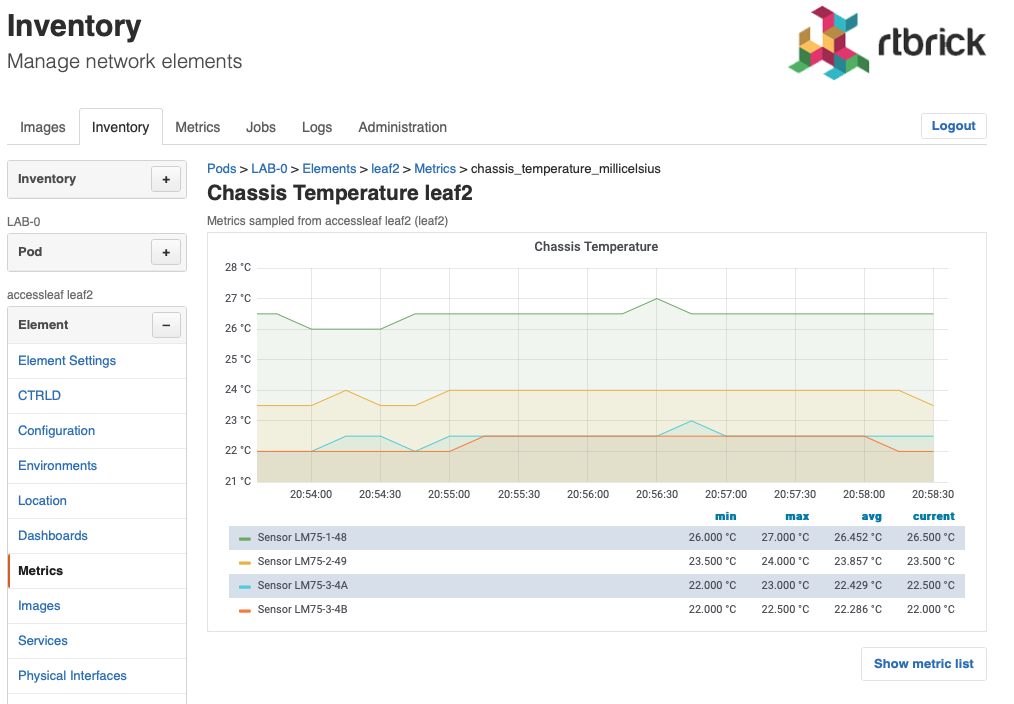
Click on graph to view the time series of a metric.
Enabling a metric
To enable a metric, go to the metric list view
-
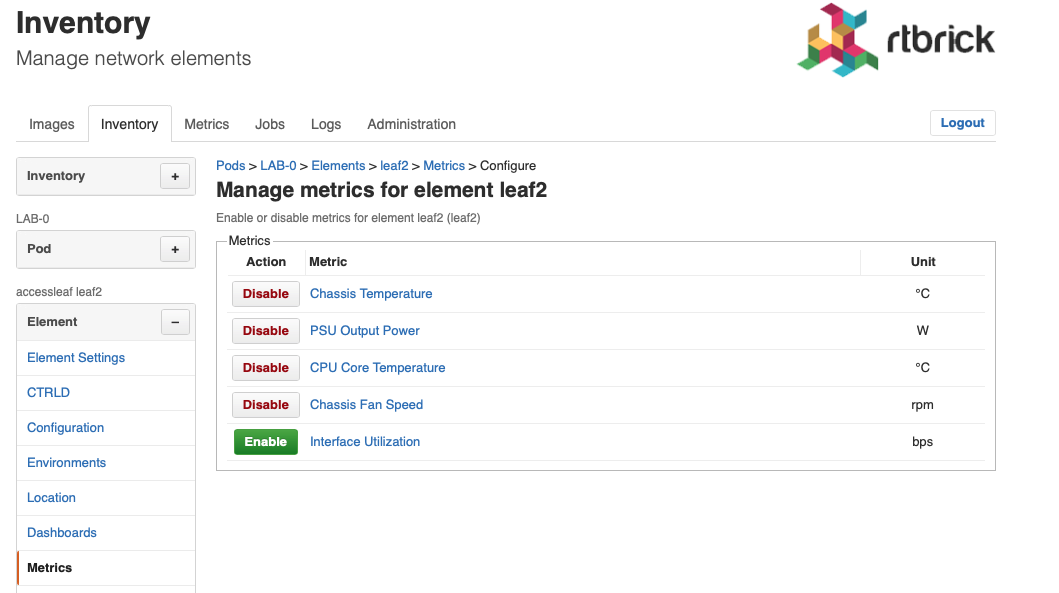
Click Configure metrics. A list of available metrics appears.
-
Click Enable for all metrics you want to enable.
Disabling a metric
To disable a metric, go to the metric list view
-
Click Configure metrics. A list of available metrics appears.

-
Click Disable for all metricy you want to disable.
Viewing element dashboards
To open a dashboards of an element
-
Click the Inventory tab. The list of pods appears.
-
Click on Elements in the left navigation pane to show the list of known elements.
-
Click on the element for which you want to access a dashboard. Use the filter to search for a particular element.
-
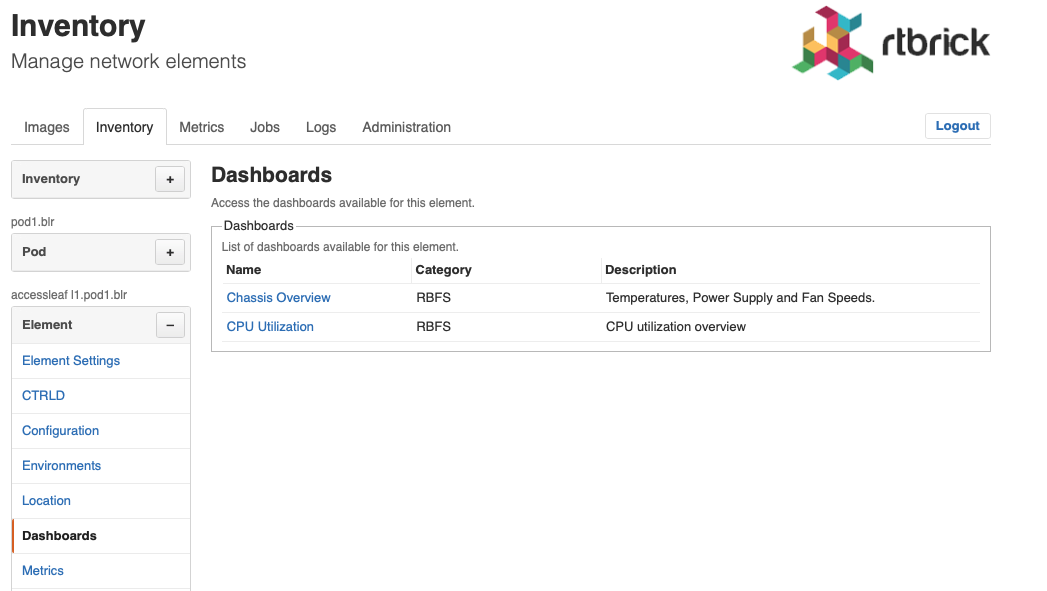
Click on Dashboards. The list of available dashboards appears.
-
Click on the Dashboard you would like to view. RBMS opens the dashboard in Grafana.
Managing metrics
Adding a new metric
To add a metric
-
Click the Metrics tab. The list of metrics appears in the Metrics page.
-
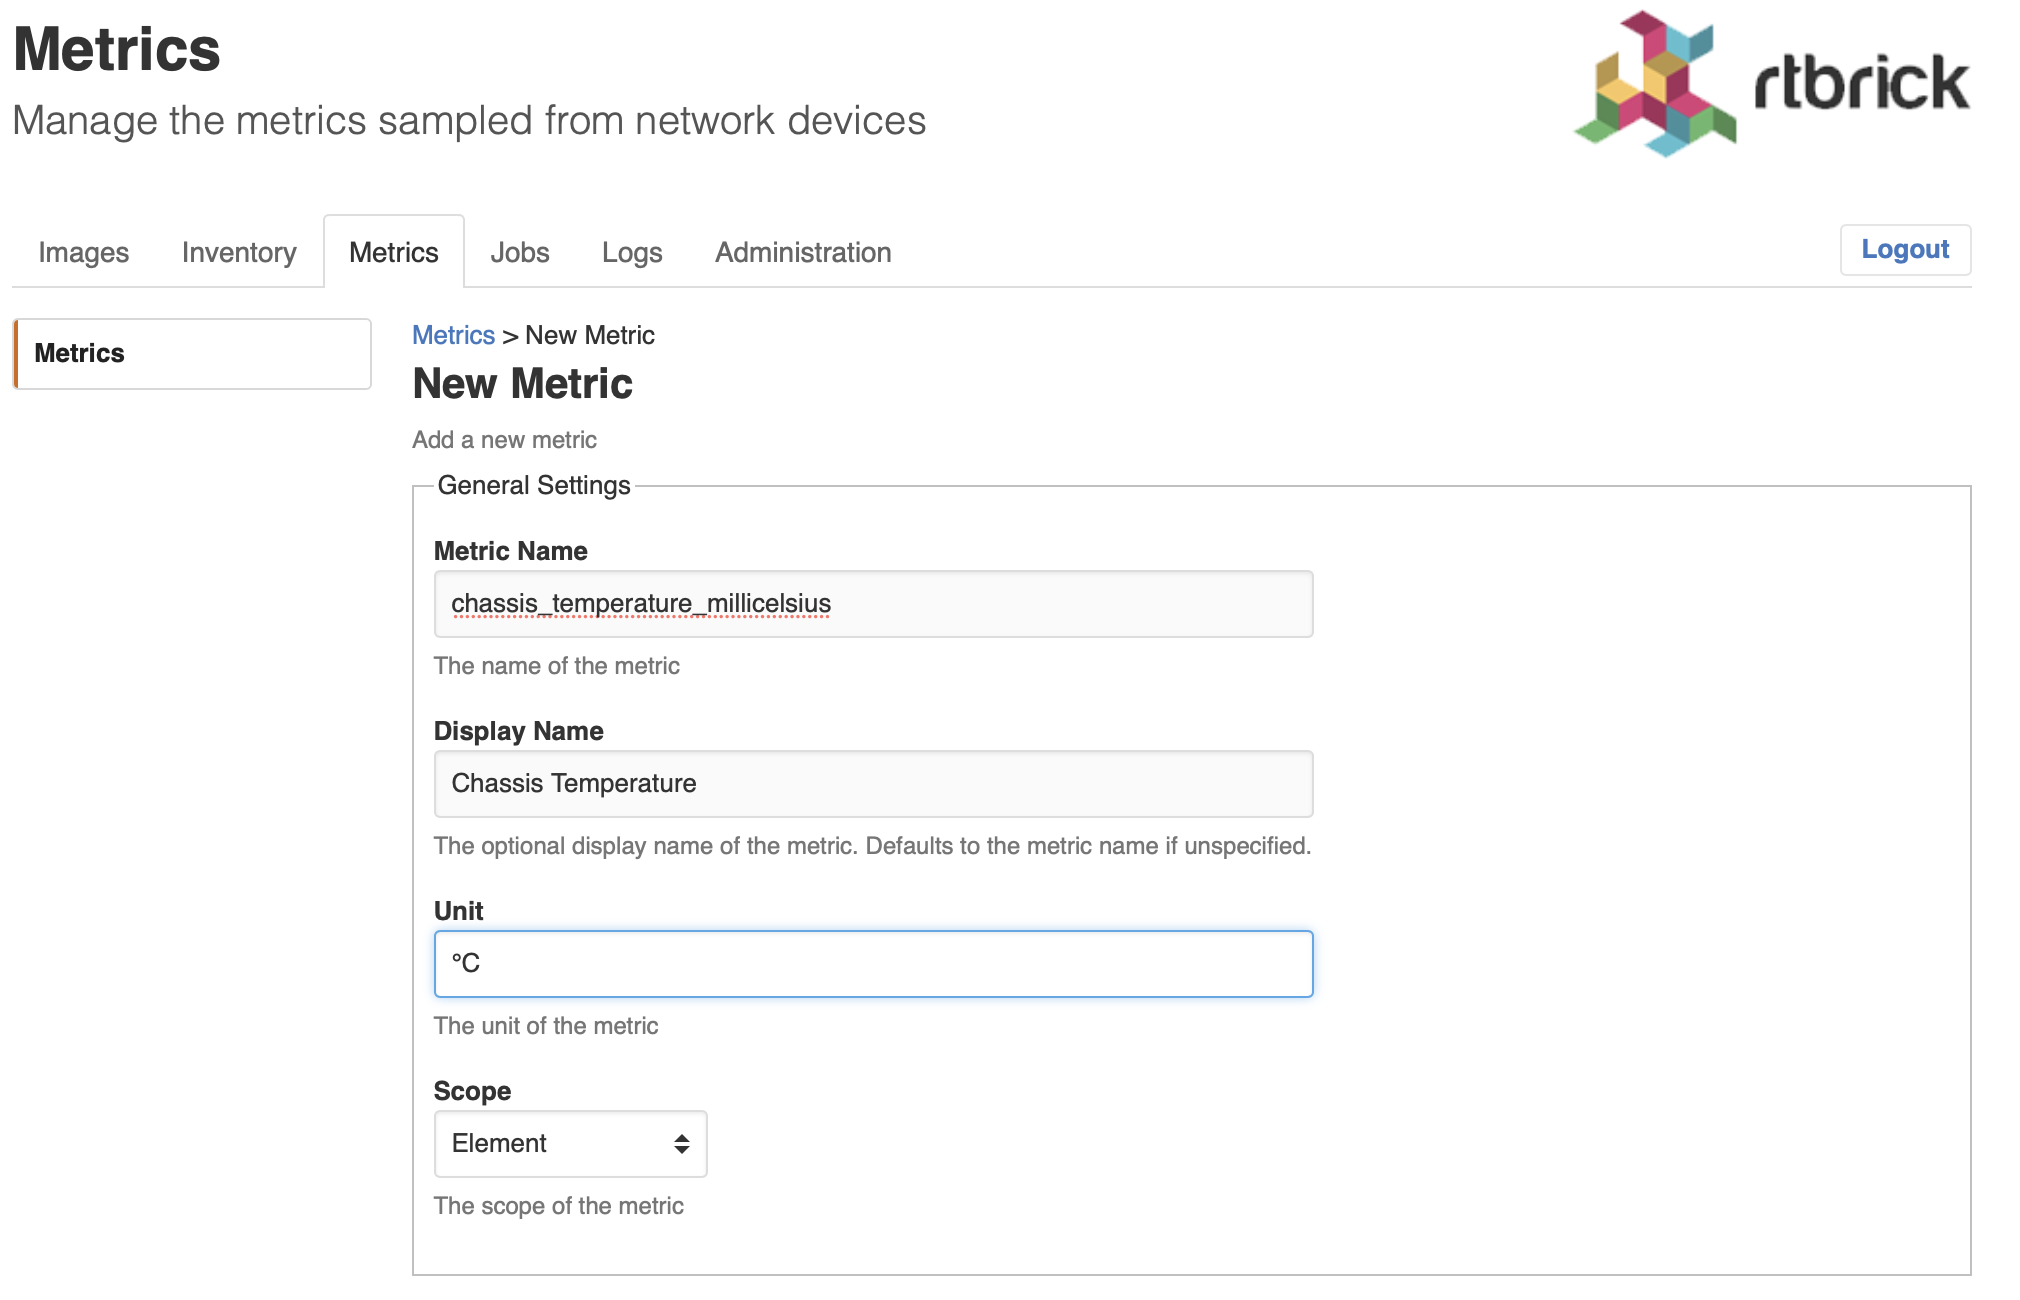
In the Metrics page, click the Add metric button. The New Metric page appears.
-
In the Metric Name field, assign a unique metric name.
| The metric name should be in lower case. The name suffix should contain the metric unit. The name prefix should be used to group metrics. Use the _ as delimiter. For example psu_powerout_milliwatts or psu_voltageout_millivolts |
-
In the Display Name field, assign a descriptive metric name.
-
In the Unit field, specify the metric unit (e.g. °C, W, bps)
-
In the Scope field, select the scope of the metric.
The following metric scopes exist:
Metric Scope |
Description |
Element |
The metric exists for the element (e.g. chassis temperature) |
Physical Interface |
The metric exists per physical interface (e.g. interface utilization) |
Service |
The metric exists per service or daemon (e.g. CPU and memory utilization of a daemon) |
Logical Interface |
The metric exists per logical interface. |
-
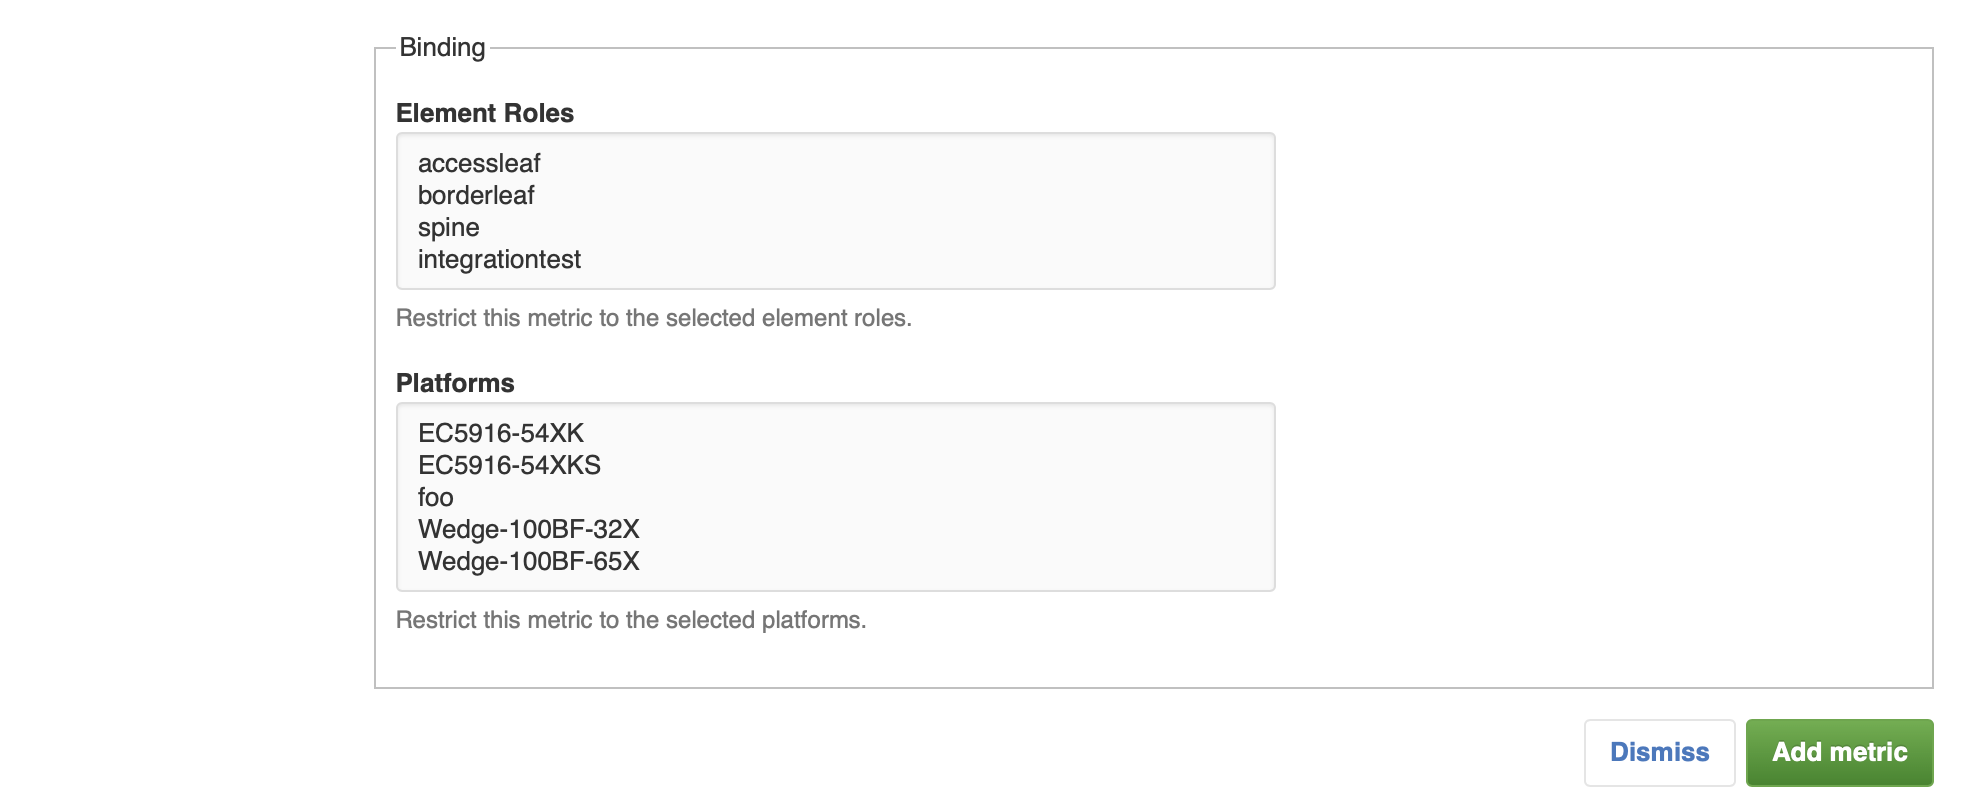
Optionally restrict the metric to certain element roles and platforms.
-
Click Add metric.
Adding the CTRLD configuration
The CTRLD configuration contains the JSON message to enable the metric via CTRLD.
To add the CTRLD configuration
-
Click Configurations in the left navigation pane. The list of configurations appears.
-
Click Add config. The New Configuration view appears.
-
Add the CTRLD JSON object to the JSON editor.
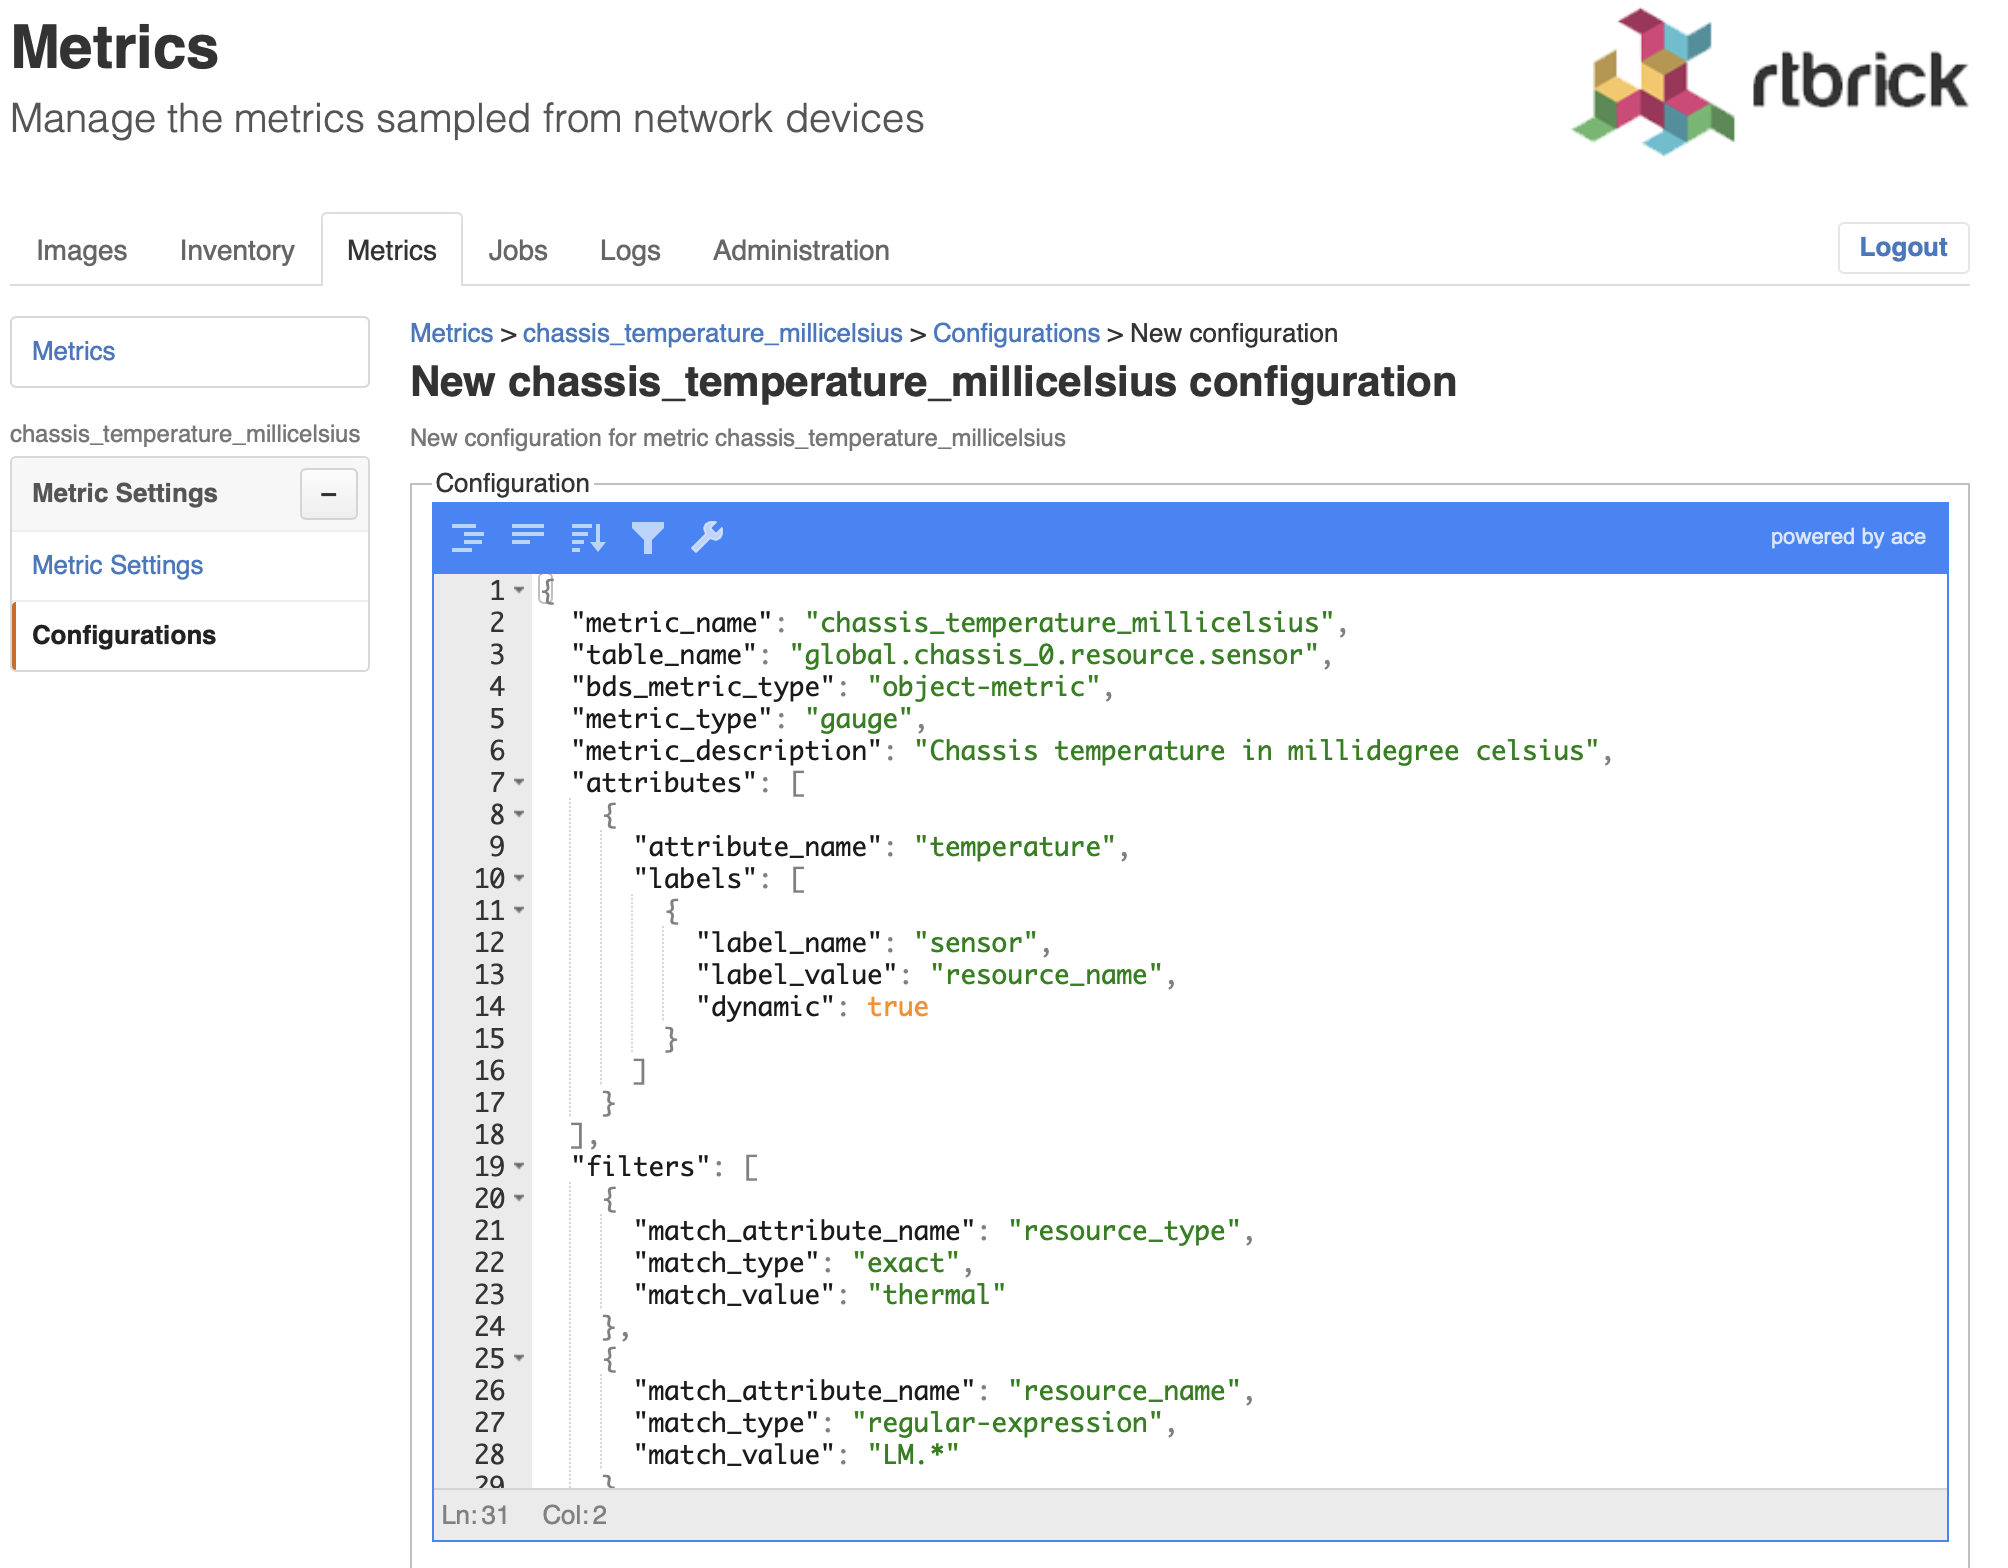
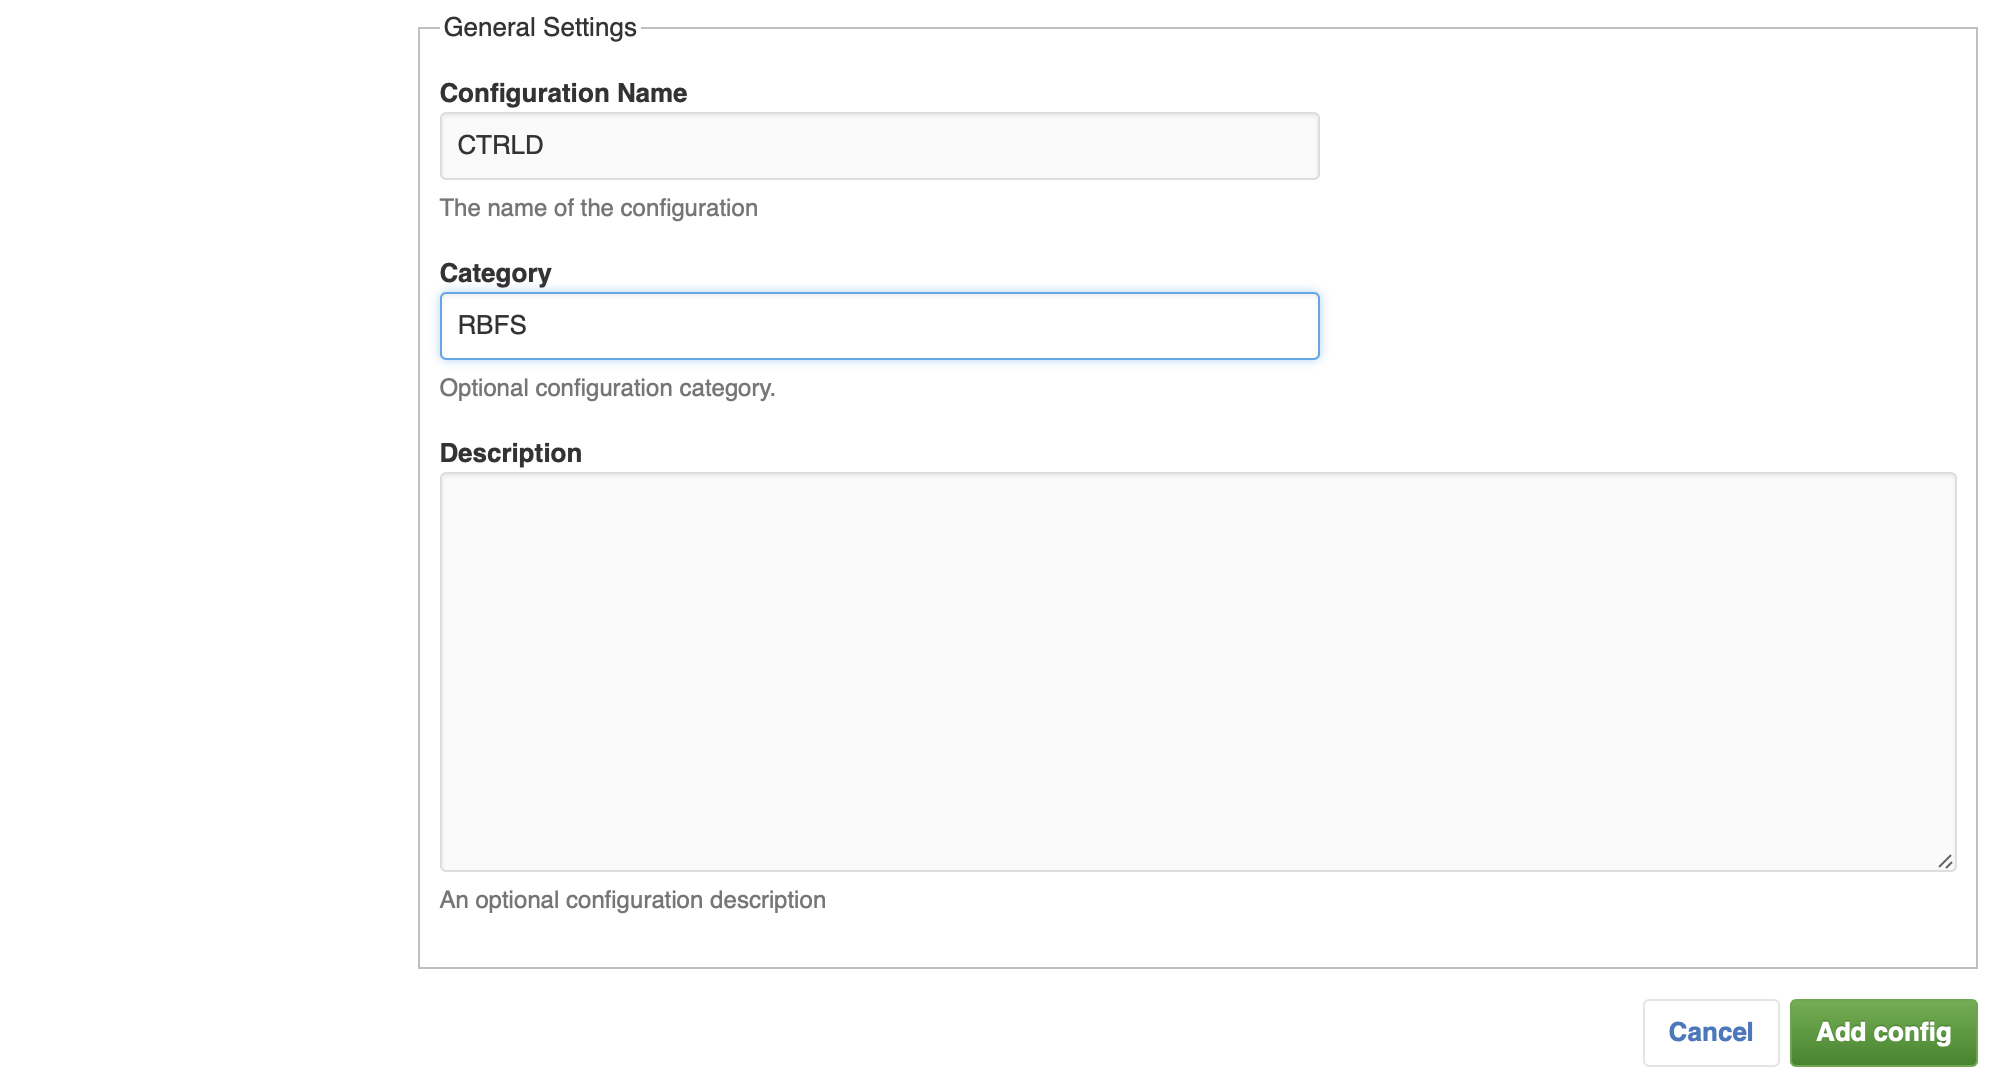
| The Metrics sampling and monitoring tutorial provides more information about how to use CTRLD API to manage metrics. |
-
In the Configuration Name field, enter CTRLD.
-
In the Category field, enter RBFS.
-
In the Description field, enter an optional description for the configuration.
-
Click Add config to add the new configuration.
The value of the metric_name attribute in the CTRLD JSON object must be equal to the metric name in RBMS to avoid trouble.
|
Adding the Prometheus configuration
The Prometheus configuration provides the Prometheus queries to fetch the metrics from Prometheus.
To add the Prometheus configuration.
-
Click Configurations in the left navigation pane. The list of configurations appears.
-
Click Add config. The New Configuration view appears.
-
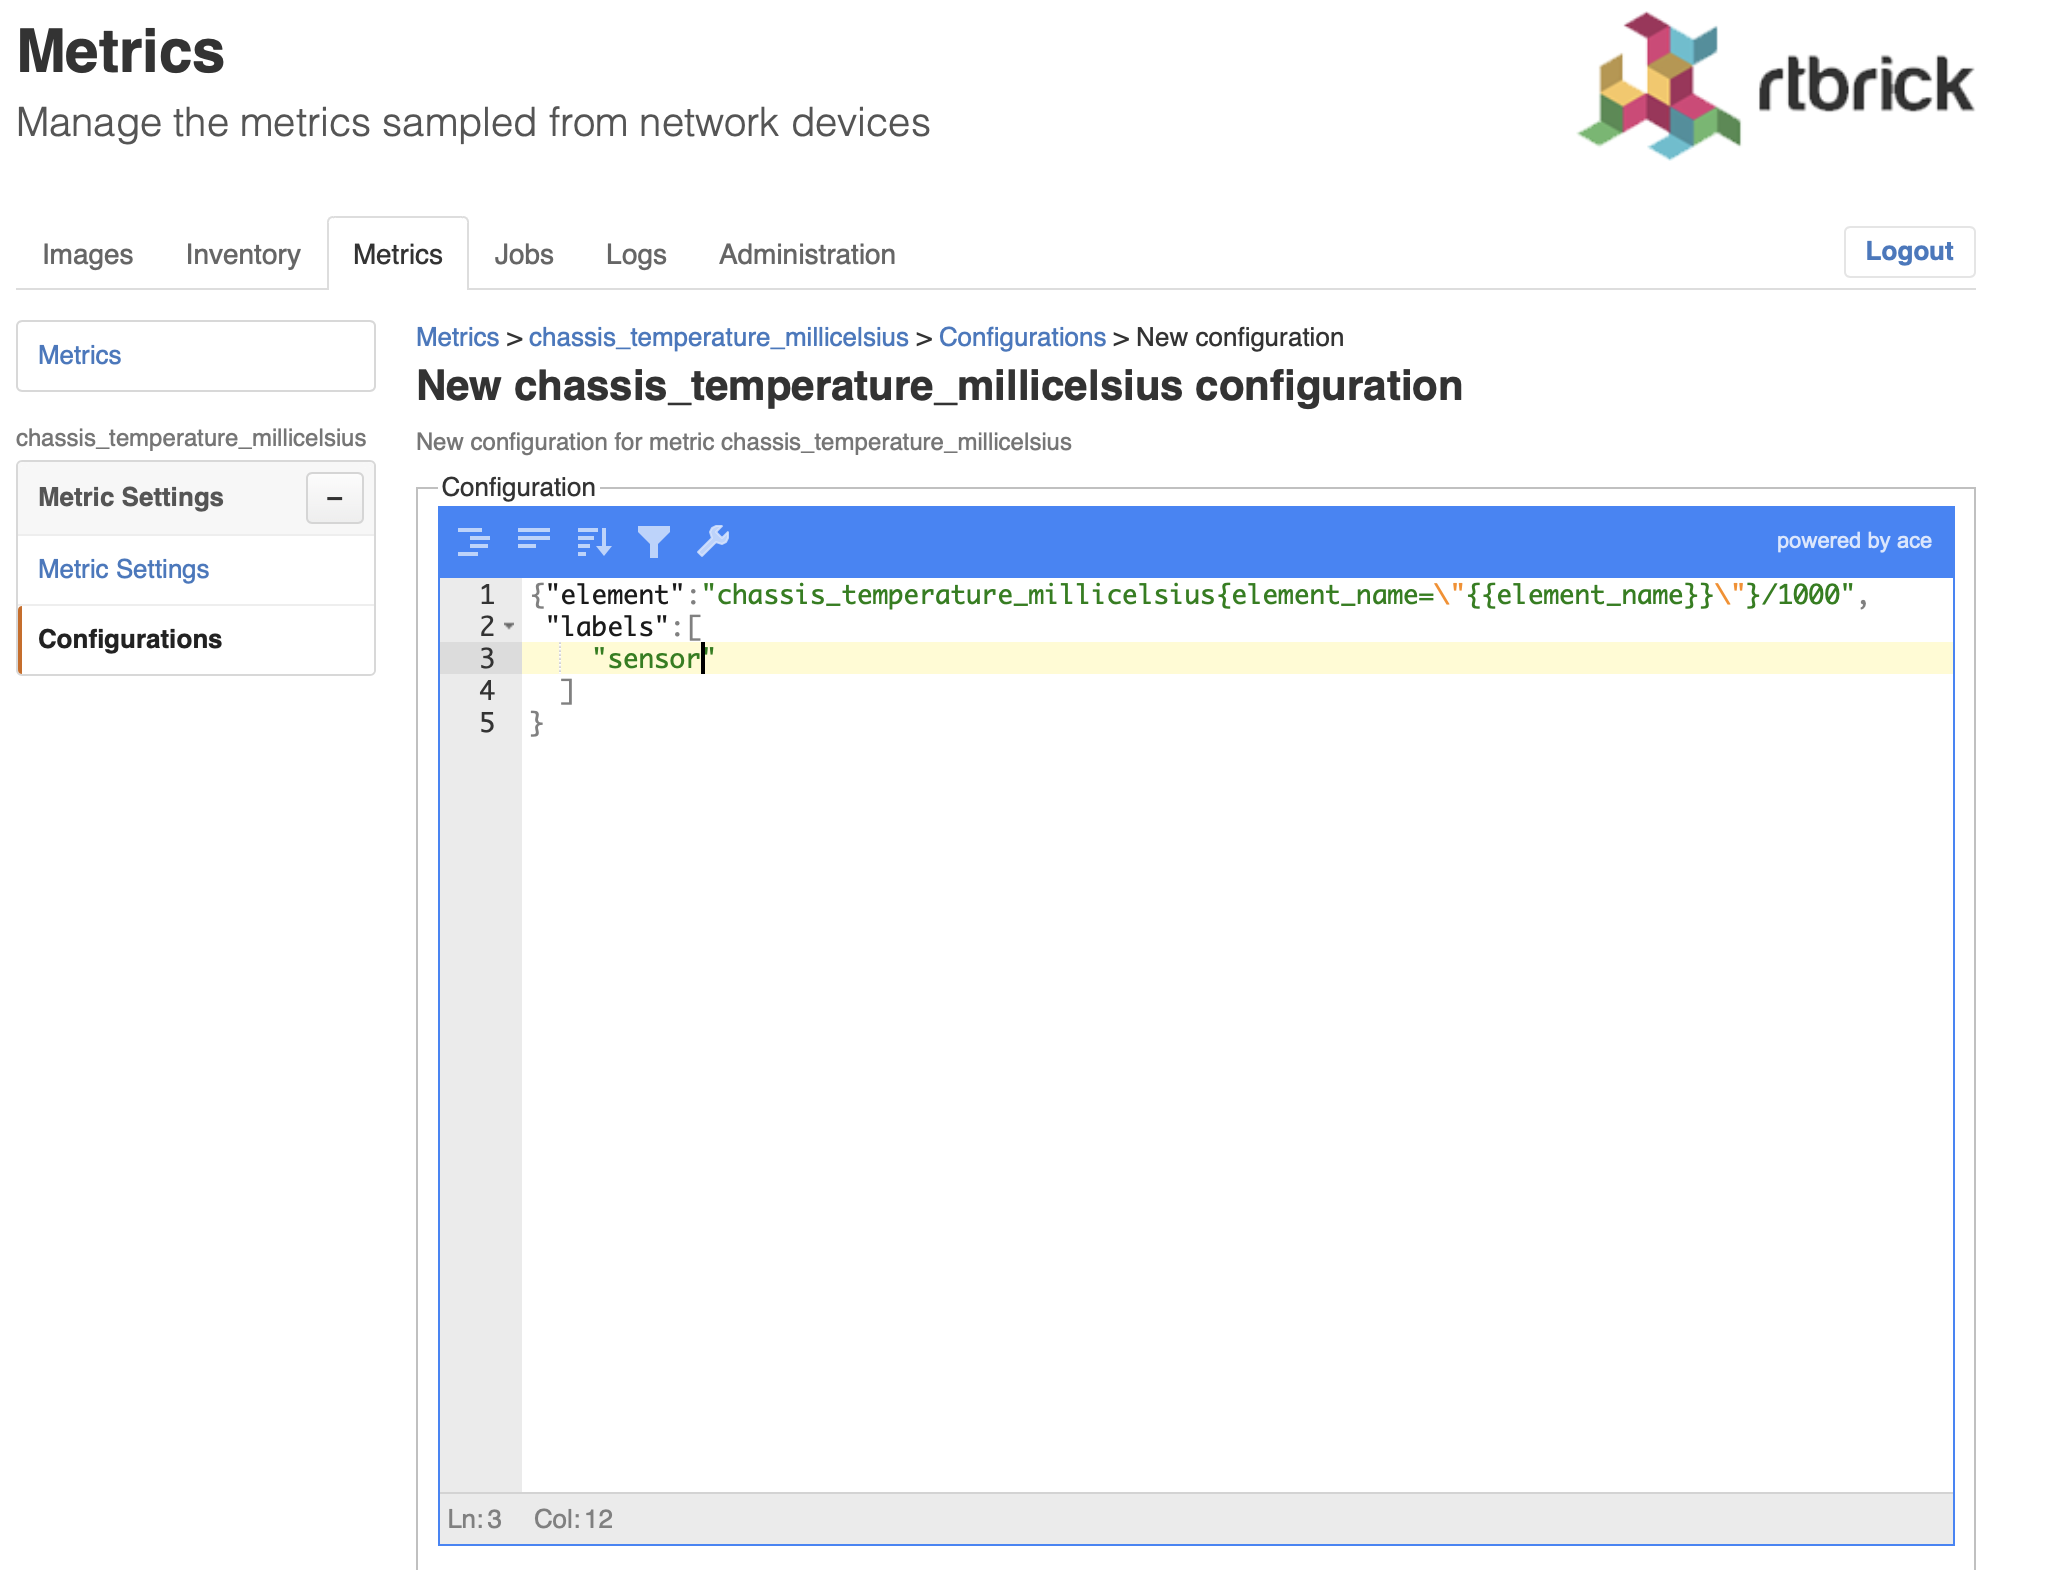
Add the Prometheus JSON object to the JSON editor.
The Prometheus JSON object contains the following properties:
Attribute |
Description |
|
The Prometheus query to fetch the metric values for an element. RBMS replaces |
|
The Prometheus query to fetch the metric values for a physical interface. RBMS replaces |
|
The Prometheus query to fetch the metric values for a logical interface. RBMS replaces |
|
The Prometheus query to fetch the metric values for a physical interfaces. RBMS replaces |
|
String array with the names of the labels that shall be displayed in the metrics list. |
-
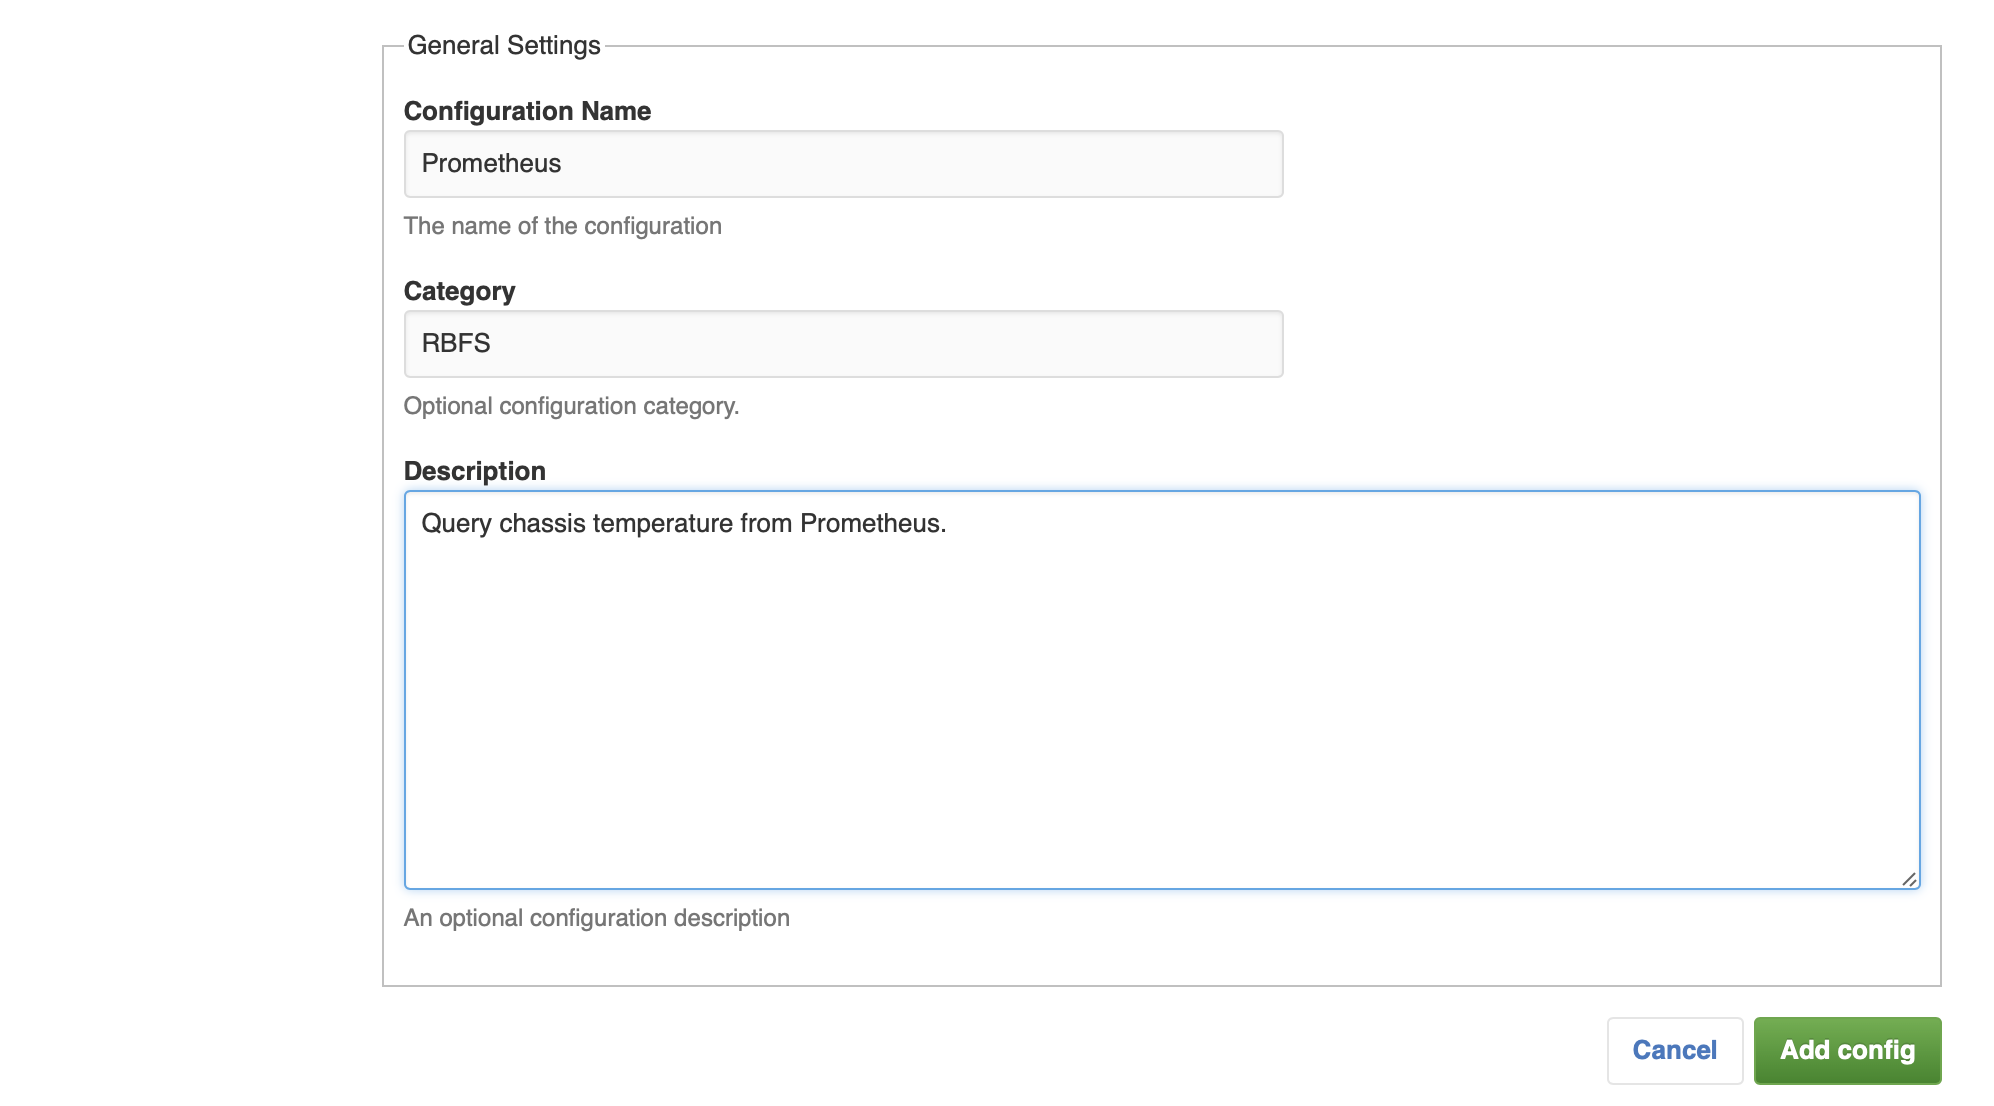
In the Configuration Name field, enter Prometheus.
-
In the Category field, enter RBFS.
-
In the Description field, enter an optional description for the configuration.
-
Click Add configuration to add the new configuration.
Removing a metric
To remove a metric from RBMS
-
Click on the Metrics tab. The list of metrics appears.
-
Click on the metric you want to remove.
-
Click on Remove metric. A confirmation dialog appears.
-
Click on Confirm to remove the metric. Check the force option to remove the metric including the metric configurations.
Managing dashboards
Registering Dashboards
Configuring the visualization platform
| RBMS needs to know the visualization platform hosting the dashboard that shall be accessible from RBMS. |
To register a visualization platform
-
Click the Inventory tab.
-
Click on + to expand the Administration menu.
-
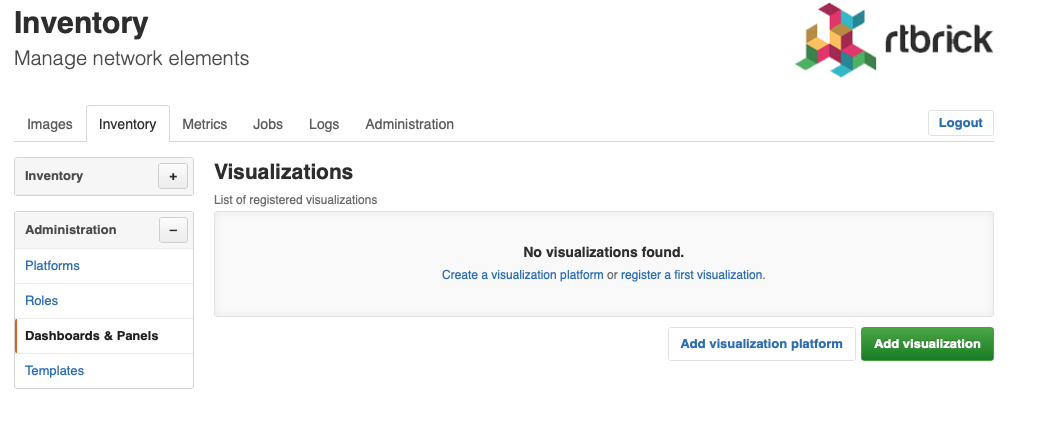
Click on Dashboard & Panels in the navigation pane. The list of registered dashboards and panels appears.
-
Click on Add visualization platform. The list of known visualization platforms appears.
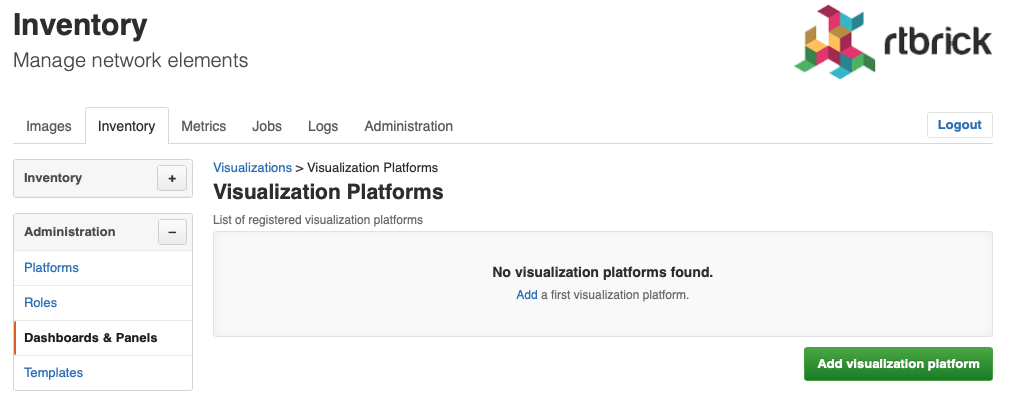
-
Click on Add visualization platform to add a new visualization platform. The New visualization platform appears.
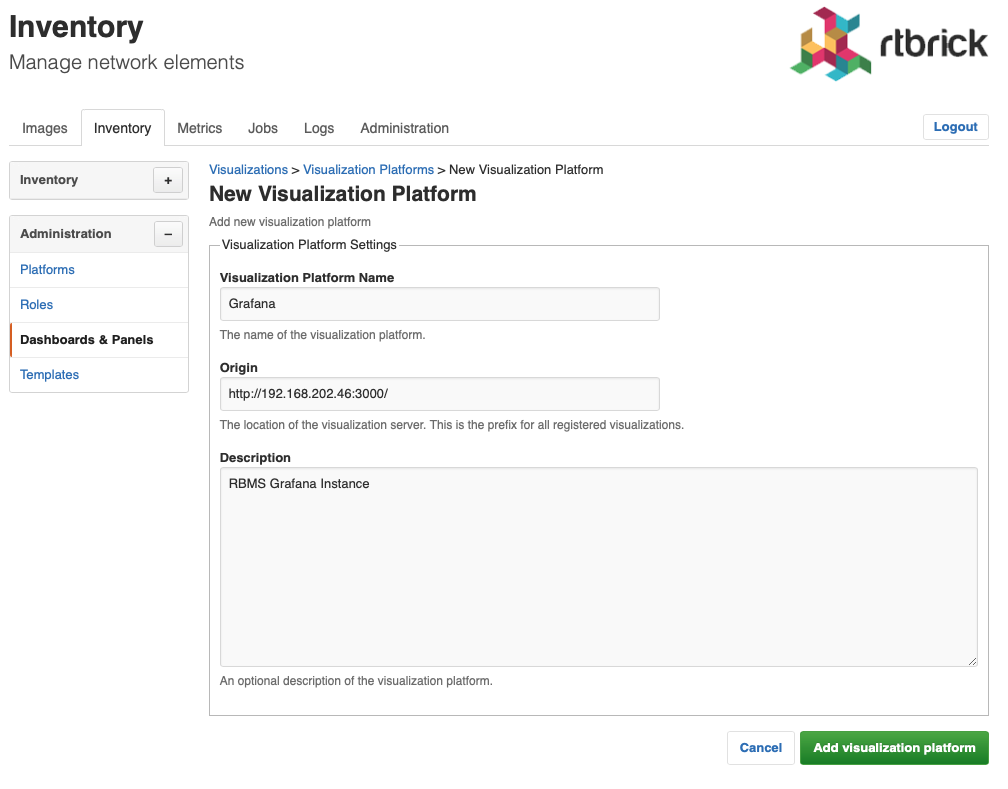
In the Name field, provide a unique visualization platform name. In the Origin field, provide the origin of the visualization. In the Description field, provide an optional description of the visualization platform.
Click Add visualization platform to add the visualization platform.
Registering a dashboard
| The dashboard must accept an element query parameter specifying the element for which the metrics shall be displayed. |
To add a Grafana dashboard to RBMS
-
Open the dasbhoard in Grafana.
-
Click the Share Icon.
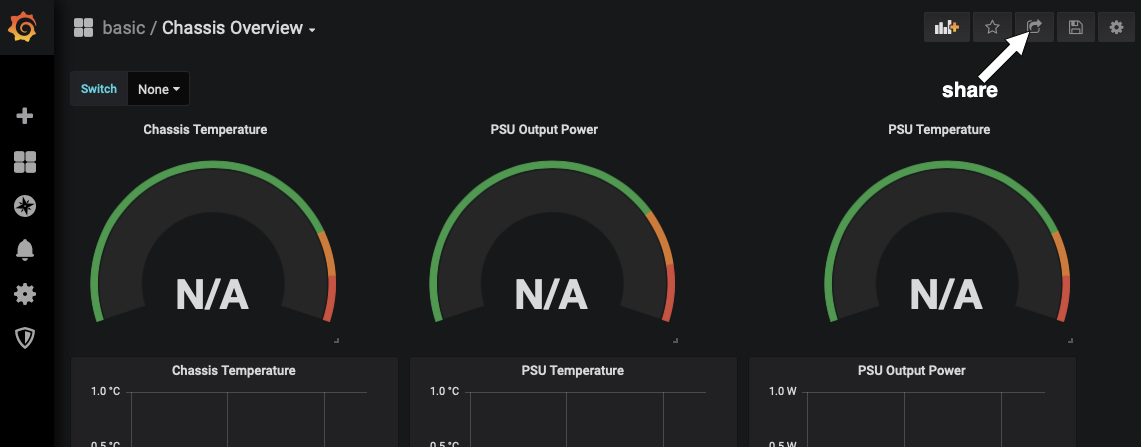
-
Uncheck the Current time option.
-
Select the light theme.
-
Click on Copy to copy the displayed link.
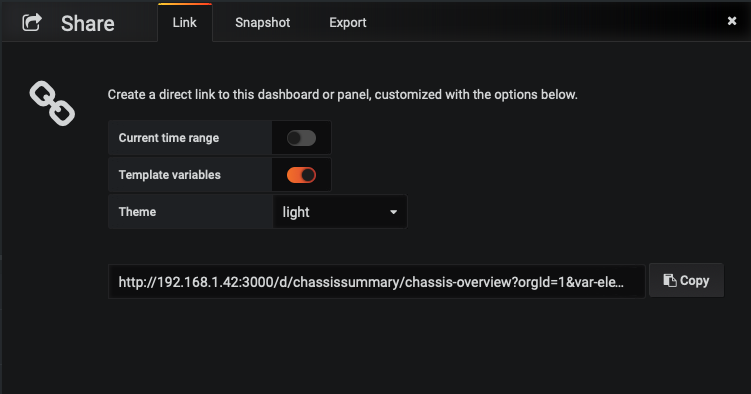
-
Proceed to RBMS.
-
Click on the Inventory tab.
-
Click on + to expand the Administration menu.
-
Click on Dashboard & Panels in the left navigation pane. The list of registered dashboard and panels appears.

-
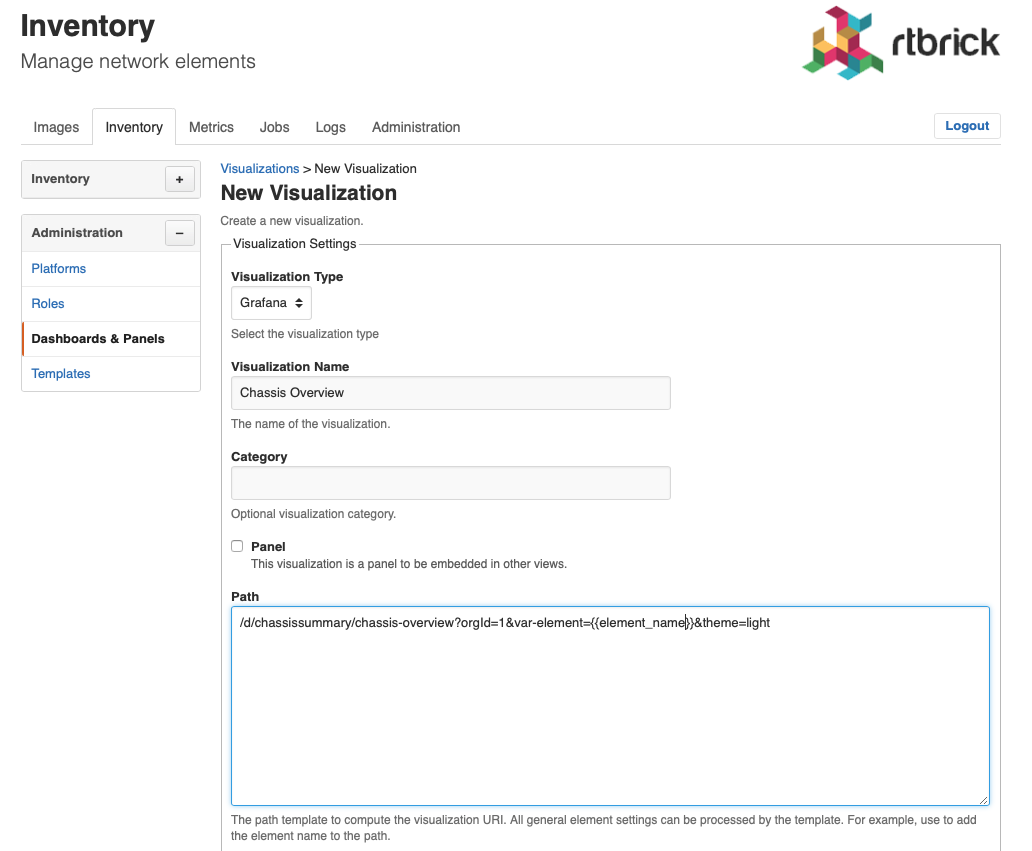
Click Add visualization. The New Visualization page appears.
-
From the Visulization Platform select box, select the Grafana instance that hosts the dashboard.
-
In the Visualization Name field, specify a unique descriptive name. The name is displayed in the dashboard list of an element.
-
In the Description field, add an optional dashboard description. The description is displayed in the element dashboard list.
-
Paste the link into the URL field. Assign
{{element_name}}as value for the element variable declared in the dashboard. RBMS replaces{{element_name}}with the name of the currently displayed element. -
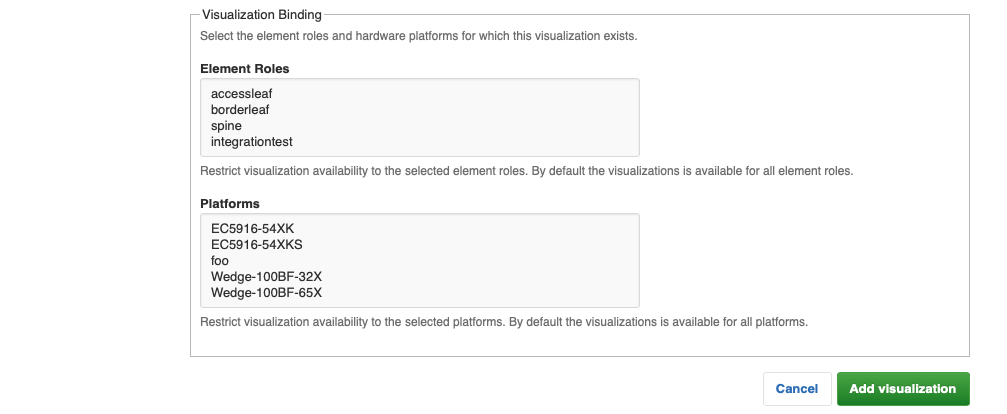
Optionally restrict the dashboards to certain element roles or platforms.
-
Click Add visualization to add the dashboard.
Registering a panel for a configured metric
| The panel must accept URL query parameters specifying the element for which the metric shall be displayed. |
To add a Grafana panel to RBMS
-
Open the dasbhoard in Grafana.
-
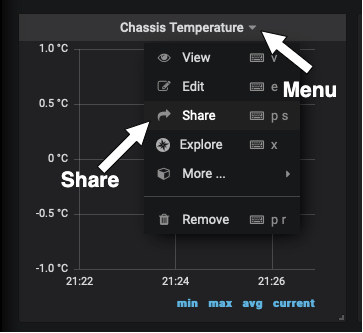
Open the context menu for the panel you want to embedd in RBMS.
-
Click the Share menu.
-
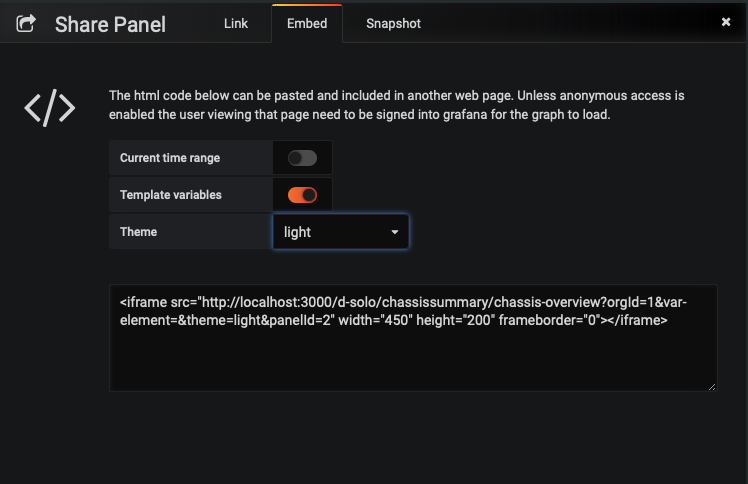
Uncheck the Current time option.
-
Select the light theme.
-
Click on Copy to copy the displayed link.
-
Proceed to RBMS.
-
Click on the Inventory tab.
-
Click on + to expand the Administration menu.
-
Click on Dashboard & Panels in the left navigation pane. The list of registered dashboard and panels appears.

-
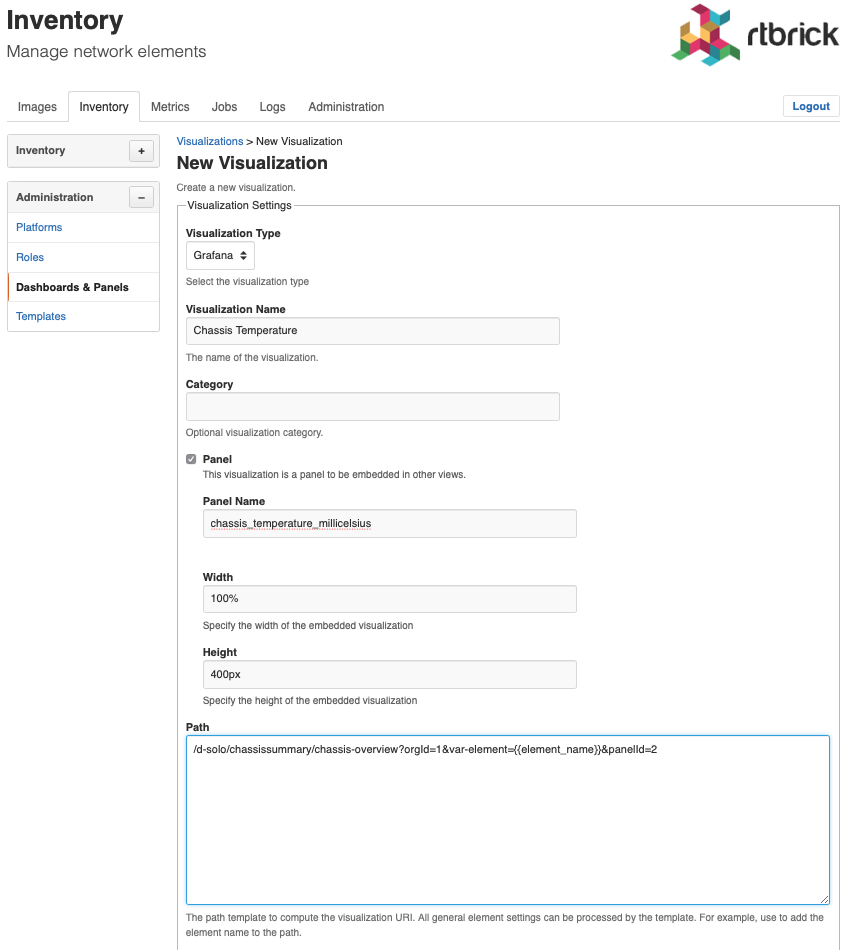
Click Add visualization. The New Visualization page appears.
-
From the Visulization Platform select box, select the Grafana instance that hosts the dashboard.
-
In the Visualization Name field, specify a unique descriptive name.
-
Check the Panel checkbox.
-
In the Panel Name field, add the name of the metric displayed in the panel.
-
In the Width field, add the width of the panel as absolute value (px or em) or in percent.
-
In the Height field, add the height of the panel as absolute value (px or em) or in percent.
-
In the Description field, add an optional dashboard description. The description is displayed in the element dashboard list.
-
Paste the link into the URL field. Assign
{{element_name}}as value for the element variable declared in the dashboard. RBMS replaces{{element_name}}with the name of the currently displayed element. -
Optionally restrict the panel to certain element roles or platforms.

-
Click Add visualization to add the panel.