Managing Logs
Introduction
In order to understand the RBMS log viewer it is key to understand the RBFS logging concept. RBFS stores log information in Brick Data Store (BDS) tables. The BDS is an in-memory database developed by RtBrick and optimized for the networking domain. The BDS log tables contain only the raw data of a log event. Exporters pass the raw data to a template string to create a human friendly log message.
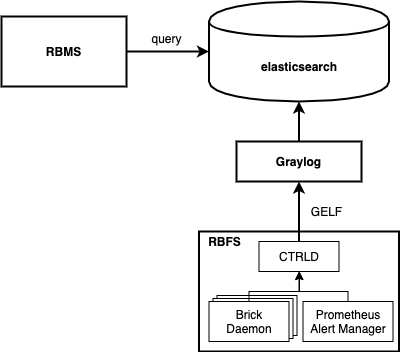
By default RBFS exports log messages in GELF format. The Graylog Extended Logging Format (GELF) is a JSON representation of the Syslog protocol, with the option to add custom fields.

The CTRLD forms the egress node for all GELF messages. CTRLD receives log messages from brick daemons, augments the GELF message with the element name, element role, serial number and pod name and forwards it to the configured GELF endpoint. In addition, CTRLD receives all notification of the Prometheus Alert Manager running on the switch and translates them to GELF messages. Last but not least, CTRLD generates GELF messages to log events.
All messages are send to a configured GELF endpoint. The GELF endpoint stores the data in a central log database. The GELF message is already a structured message. Thus the endpoint does not have to create a log message into a structured record.
RBMS queries log events from the log management system to provide quick access to log messages. In addition, RBMS links all log messages to the inventory records to quickly inspect the state of an element.
Viewing log events
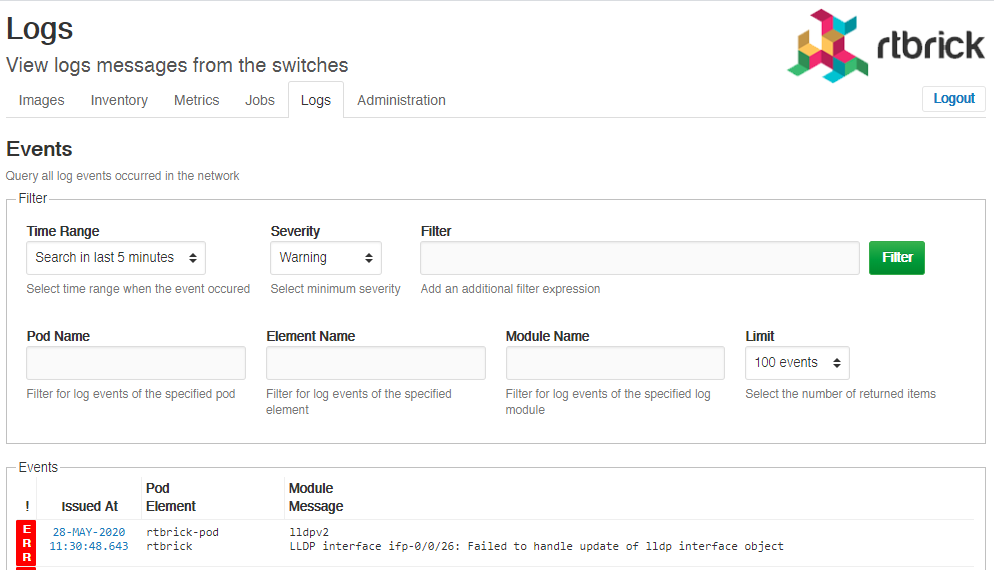
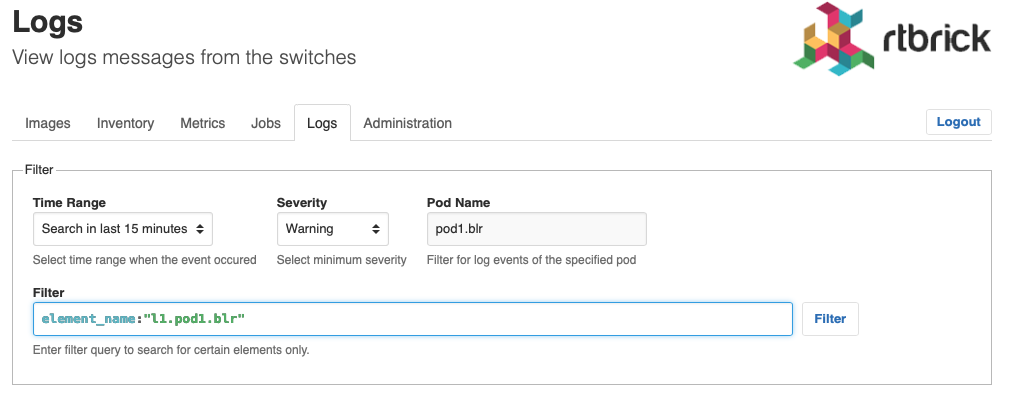
The log viewer reads log records from the Elasticsearch database. The query is formed from the resource inventory data and can be amended by the operator to fine-tune the result set. You can inspect the details of a log message in the RBMS UI.
To view the list of logs
-
Click the Logs tab. The list of all log events occurred in the network within the last five minutes having at least WARNING severity appears.

-
Click the timestamp of the event that you want to view.
