1. RBMS Installation Guide
This document guides you through the installation and initial setup of RBMS.
1.1. Before you start
1.1.1. Prerequisites
RBMS is shipped in docker container images which are made available on docker.rtbrick.com.
RBMS requires docker and docker-compose to be installed on your system.
docker-compose simplifies the setup process by running all containers from a provided manifest file with a single command.
Please follow the instructions in Get docker and Install docker-compose of the official docker documentation to install docker and docker-compose.
There is no advanced knowledge of docker needed to follow the installation instructions in the RBMS installation guide. All important commands to run the RBMS docker containers from the provided RBMS docker images are outlined in this installation guide.
|
|
sudo privileges are needed to install RBMS.
|
1.1.2. Preparing your user account to work with docker
Add your user to the docker group to not have to prepend all docker commands with sudo any longer.
Run the following command to add your user to the docker group.
~$ sudo usermod -aG docker $(whoami)Exit the terminal and connect again to make the changes taking effect.
1.2. Overview
The installation process consists of the following phases:
-
RBMS setup
-
Grafana and Prometheus setup
-
Graylog setup
The RBMS setup addresses the installation of RBMS itself, including the RBMS database, applications and web user interface.
Prometheus, an open-source monitoring tool, samples metrics from the switches and stores them in a time series database. Grafana, an open-source visualization platform, provides means to visualize and inspect the metrics gathered by Prometheus. The Grafana and Prometheus setup installs both tools with pre-provisioned dashboards for a quick start.
Graylog is an open-source log management system. It stores data in an Elasticsearch database and provides means to automate log processing. The switches send log messages to Graylog. RBMS queries Elasticsearch to show the received log messages. The Graylog setup guides you through the steps to make Graylog ready for receiving log messages from RBFS.
1.3. Prepare Installation
Create the /opt/rbms folder and change to this directory.
~$ sudo mkdir -p /opt/rbms && cd "$_"Extract the rbms.tar ball.
/opt/rbms$ sudo tar -xvf rbms.tar && rm rbms.tarThe following files and folders have been added to the /opt/rbms directory:
/opt/rbms$ tree -L 4 .
.
|-- docker-compose.yaml
|-- postgres
|   |-- data
|-- rbms.env
|-- telemetry
|   |-- docker-compose.yaml
|   |-- grafana.env
|   |-- grafana.ini
|   |-- prometheus
|   |   |-- etc
|   |       |-- bds.target.yml
|   |       |-- prometheus.yml
|   |-- provisioning
|       |-- dashboards
|       |   |-- basic
|       |   |-- default.yml
|       |   |-- fibd
|       |-- datasources
|           |-- default.
|-- templates
|-- wildfly
|   |-- logs
|-- ztp
    |-- configs

15 directories, 9 files-
The
docker-compose.yamlfile contains the instructions to run the RBMS docker containers. -
The
postgresdirectory contains the data of the RBMS database. -
The
rbms.envfile contains the environment-specific settings. More details about the environment variables can be found in the next section. -
The
telemetrydirectory contains the configuration for Prometheus and Grafana to gather and visualize metrics from switches. More details about configuring Prometheus and Grafana can be found later in this document. -
The
templatesfolder contains templates for configuration generation. -
The
wildflydirectory contains the logs of the RBMS applications. Wildfly is an open-source application server hosting the RBMS application. -
The
ztpdirectory contains the startup-configuraton for the switches in the network. More details about ZTP configuration can be found in post installation tasks section in this document.
1.4. RBMS Setup
The first step is to install the RBMS application, database and user interface. All services are started via docker-compose in a single command. However, before running this command, the RBMS environment variables need to be set for your environment.
1.4.1. Configuring RBMS Environment variables
The rbms.env file contains all RBMS environment variables.
|
|
The <RBMS_IP_OR_HOST> placeholder needs to be replaced by the actual IP address or host name. |
Detailed information about the existing environment variables can be taken from the tables below:
| Environment Variable | Description |
|---|---|
POSTGRES_DB |
The name of the RBMS database (Default: leitstand) |
POSTGRES_USER |
The postgres user name (Default: leitstand) |
POSTGRES_PASSWORD |
The postgres user password. RBMS uses the provided credentials to connect to the database (Default: changeit) |
LEITSTAND_DB_URL |
The JDBC connections string to establish a database connection to the created database (Default: jdbc:postgresql://rbms-db:5432/leitstand) |
LEITSTAND_DB_USER |
The user name to authenticate Leitstand for establishing a database connection (Default: leitstand) |
LEITSTAND_DB_PASSWORD |
The password for the specified LEITSTAND_DB_USER (Default: changeit) |
LEITSTAND_TERMINAL_EMULATOR_ENDPOINT |
The external URL to access the RBMS terminal emulator (Default: http://<RBMS_IP_OR_HOST>/ssh/host, where <RBMS_IP_OR_HOST> needs to be replaced by the actual IP address or DNS name) |
LEITSTAND_ACCESS_CONTROL_ALLOW_ORIGIN |
Sets the origins from which RBMS UI is allowed to embedd content from (Default: *). |
ELASTICSEARCH_ENDOINT |
Sets the endpoint URL of the Elasticsearch API |
TEMPLATE_ENGINE_ENDPOINT |
Sets the endpoint URL of the template engine rendering RBFS configurations (Default: http://rbms-fabric-template-engine) |
ZTP_SERVICE_ENDPOINT |
Sets the enpoint URL of the ZTP service to publish new device configurations. |
GRAFANA_UI_ENDPOINT |
The URL to access the Grafana user interface. |
In addition, the following environment variable exist to connect RBMS with an OAuth2/OpenID Connect-compliant authorization service.
| Environment Variable | Description |
|---|---|
OIDC_CONFIGURATION_ENDPOINT |
URL to auto-discover the authorization settings. |
OIDC_CLIENT_ID |
Client identifier to authenticate RBMS against the authorization service. |
OIDC_CLIENT_SECRET |
The shared secret to authenticate RBMS against the authorization service. |
OIDC_CONNECT_TIMEOUT |
Connect timeout in milliseconds to establish a connection to the authorization service. Defaults to 10 seconds. |
OIDC_READ_TIMEOUT |
Read timeout in milliseconds to wait for response from the authorization service. Defaults to 10 seconds. |
Add the following environment variables if your authorization service does not support automatic configuration discovery.
| Environment variable | Description |
|---|---|
OIDC_AUTHORIZATION_ENDPOINT |
Authorization service URL to prompt an unauthenticated user for credentials. |
OIDC_TOKEN_ENDPOINT |
Token service endpoint URL to obtain an access token from. |
OIDC_USERINFO_ENDPOINT |
User info endpoint URL to query the user profile of the authenticated user. |
OIDC_TOKEN_X5C |
Base64 URL-encoded X509 certificate chain to verify JWS tokens signed with asymmetric keys. |
OIDC_TOKEN_SECRET |
Token secret to verify JWS tokens signed with symmetric key. |
OIDC_JWS_ALGORITHM |
The token signature algorithm (e.g. HS256) |
In case you prefer the RBMS built-in user repostory, you have to provide a secret to sign all issued access tokens.
| Environment variable | Description |
|---|---|
JWS_SECRET |
The secret for signing the issued access tokens. RBMS uses HS256 to sign access tokens and the provided secret must have a minimum length of 256 bits. |
1.4.2. Setting File System Permissions
|
|
root group requires write access to the postgres/data and wildfly/logs directories.
|
This can be acchieved by transferring ownership to root and modifying the file permissions accordingly:
/opt/rbms$ sudo chown root:root  postgres/data
/opt/rbms$ sudo cmod 775  postgres/data
/opt/rbms$ sudo chown root:root  wildfy/logs
/opt/rbms$ sudo cmod 775  wildfly/data
1.4.3. Starting RBMS Containers
Run docker-compose up -d to start RBMS.
This command pulls all docker images from docker.rtbrick.com and starts the following containers:
| Container | Description |
|---|---|
rbms-pxy |
Nginx reverse proxy as ingress node for all incoming HTTP traffic |
rbms-app |
RBMS application and web user interface |
rbms-db |
Postgresql database to store the RBMS data |
rbms-terminal |
Terminal emulator to access a switch terminal from the browser |
rbms-fabric-template-engine |
Template engine to render switch configurations from templates. |
rbms-fabric-ztp |
ZTP service providing access to the startup configuration and installer images. |
1.5. Grafana and Prometheus Setup
Change to the /opt/rbms/telemetry directory.
~$ cd /opt/rbms/telemetry/This directory contains the following artefacts:
- docker-compose.yaml file to create the Grafana and Prometheus docker containers.
- grafana.env file to configure the Grafana environment.
- prometheus/etc directory to configure Prometheus.
1.5.1. Configuring Prometheus
Change to the /opt/rbms/telemetry/prometheus/etc directory:
~$ cd /opt/rbms/telemetry/prometheus/etcEdit the bds.target.yml file and add the CTRLD endpoint for all switches to the list of targets.
Say you run four switches in your fabric:
| Switch | IP Address |
|---|---|
l1.pod1 |
192.168.1.10 |
l2.pod1 |
192.168.1.11 |
s1.pod1 |
192.168.1.20 |
s1.pod1 |
192.168.1.21 |
then the following targets need to be added to the bds.target.yml file:
# l1.pod1
- targets: ['192.168.1.10:19091']
  labels:
    __metrics_path__: "/api/v1/rbfs/elements/l1.pod1/services/prometheus/proxy/federate"
# l2.pod1
- targets: ['192.168.1.11:19091']
  labels:
    __metrics_path__: "/api/v1/rbfs/elements/l2.pod1/services/prometheus/proxy/federate"
# s1.pod1
- targets: ['192.168.1.20:19091']
  labels:
    __metrics_path__: "/api/v1/rbfs/elements/s1.pod1/services/prometheus/proxy/federate"
# s2.pod1
- targets: ['192.168.1.10:19091']
  labels:
    __metrics_path__: "/api/v1/rbfs/elements/s2.pod1/services/prometheus/proxy/federate"
The targets attribute specifies the CTRLD endpoint.
The metrics_path label sets the path to pull the metrics from the configured CTRLD endpoint.
Prometheus reloads the file periodically. See the Prometheus configuration guide for more information about Prometheus configurations.
|
|
Run docker restart rbms-prometheus to apply changes immediately.
|
1.5.2. Configuring Grafana environment
Change to the /opt/rbms/telemetry directory:
~$ cd /opt/rbms/telemetryEdit the grafana.env file to configure Grafana and enable Single Sign-On (SSO) using OAuth2/OpenID Connect.
|
|
Single Sign-On is key to embed Grafana dasbhoard panels seamlessly in the RBMS UI. |
The following environment variables exist:
| Environment Variable | Description |
|---|---|
GRAFANA_UI_ENDPOINT |
The URL to access the Grafana user interface. |
AUTH_SERVICE_ENDPOINT |
The URL to prompt a user for credentials. |
TOKEN_SERVICE_ENDPOINT |
The URL to obtain the access token from. |
USERINFO_ENDPOINT |
The URL to obtain the user profile information of the authenticated user. |
CLIENT_ID |
The client identifier to authenticate Grafana against the authorization service. |
CLIENT_SECRET |
The client secret to authenticate Grafana against the authorization service. |
ADMIN_USER_EMAIL |
The email address of the Grafana admin account that is allowed to configure Grafana. |
|
|
The ADMIN_USER_EMAIL environment is mandatory to create an administrator account that can then nominate additional administrators in Grafana.
|
|
|
The RBMS built-in user repository also includes a minimal authorization flow implementation to enable Single Sign-On for Grafana if no authorization service is available. |
Use the following settings to connect Grafana to the built-in authorization flow shipped with RBMS:
AUTH_SERVICE_ENDPOINT=http://<RBMS_IP_OR_HOST>/api/v1/oauth2/authorize
TOKEN_SERVICE_ENDPOINT=http://<RBMS_IP_OR_HOST>/api/v1/oauth2/token
USER_INFO_ENDPOINT=http://<RBMS_IP_OR_HOST>/api/v1/oidc/userinfo
Replace <RBMS_IP_OR_HOST> with the IP address or DNS name of your RBMS installation.
1.5.3. Starting Grafana and Prometheus
Run docker-compose up -d to run Grafana and Prometheus
This command pulls the Grafana and Prometheus images runs the following containers from them:
| Container | Description |
|---|---|
rbms-grafana |
Grafana to visualize RBFS time series data |
rbms-prometheus |
Prometheus to scrape metrics from the switches |
1.6. Graylog Setup
Graylog is an open-source enterprise log management system. It stores data in an Elasticsearch database and provides means to query and process log files.
The RBMS distribution includes a dockerized Graylog allowing you to setup Graylog quickly for a first try.
|
|
RBMS can be connected to other log management systems by providing a connector that translates the RBMS log queries to queries of the underlying log managment system. |
Change to the `log` directory.
~$ cd /opt/rbms/log/Edit graylog.env and provide the IP address or hostname of your graylog server.
Run sudo sysctl -w vm.max_map_count=262144 to grant sufficient virtual memory for Elasticsearch.
Run docker-compose up -d to start Graylog. This commands pulls the Graylog, MongoDB and Elasticsearch images and runs the following three containers:
| Container | Description |
|---|---|
graylog3 |
The graylog log management application. |
graylog3-mongo |
The mongo database to store the graylog configuration and metadata |
graylog3-elastic |
The elastcisearch database to store the log data. |
Log in to Graylog UI using default credentials (admin/admin).
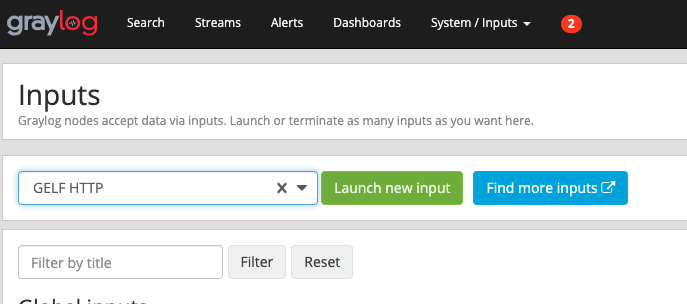
Click System and select Inputs.
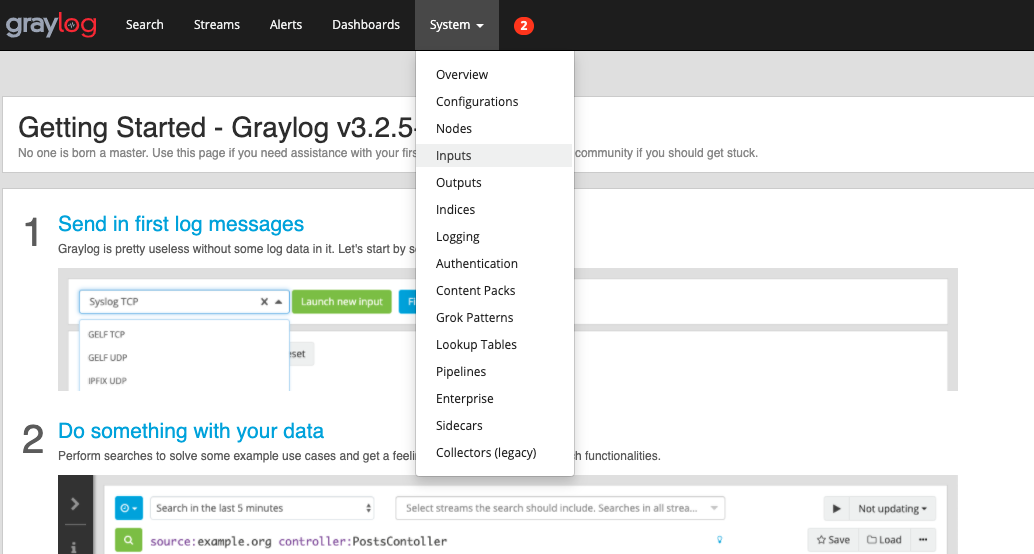
Select GELF HTTP from the drop down list.
Click Launch new input
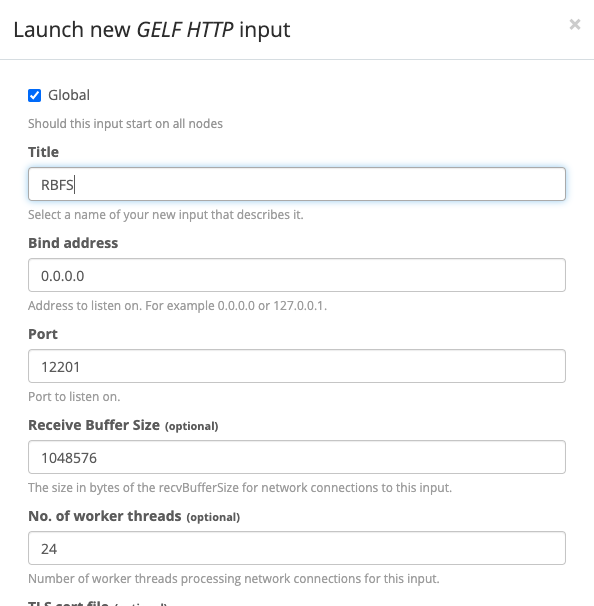
Check the Global option.
In Title add a descriptive name (e.g. RBFS)
Click Save. A new GELF input is displayed.
1.7. Post Installation Tasks
1.7.1. User and Group Management
Create the users and groups with RBMS access privileges.
1.7.2. Network Inventory Management
Start population the inventory with information about your network, including network facilities, pods and elements.
Use rtb-image to register software images in RBMS.
Create configuration templates to generate switch configurations.
Issue an accesskey for CTRLD to grant RBMS access for CTRLD.
This is required to allow CTRLD to maintain switch information in the RBMS inventory.
The accesskey should include the ivt.element and job.task scopes.
1.7.3. Zero-Touch Provisioning (ZTP)
Configure the DHCP server to convey the DHCP options required by ONIE to discover the ONL installer image.
©Copyright 2024 RtBrick, Inc. All rights reserved. The information contained herein is subject to change without notice. The trademarks, logos and service marks ("Marks") displayed in this documentation are the property of RtBrick in the United States and other countries. Use of the Marks are subject to RtBrick’s Term of Use Policy, available at https://www.rtbrick.com/privacy. Use of marks belonging to other parties is for informational purposes only.